


MISP performance tuning
Whilst starting out with MISP may be a simple task of simply installing the application or deploying a container, meaning that MISP for most users, MISP is a turnkey solution, for example when using the official Docker installation.
That said, performance can degrade once a sufficiently large corpus of data has built up and users are hammering the system (we are also dealing with instances with indicator counts in the billions and several thousand users). There are a host of remedies available to MISP admins at their disposal to get the most out of their instance and this blog post aims to serve as guidance on how to get the most out of your instance.
At the MISP-project, we have built up over a decade of experience tackling the more challenging scenarios and in this guide we’ll be touching on a host of recommendations - from hardware and software choices, through tuning settings all the way to using the toolbox of handy gadgets that allow you to identify bottlenecks.
1. Hardware recommendations
When it comes to selecting the hardware specs of the server that will be powering your MISP instance, there are some recommendations that are worth keeping in mind. These will depend heavily on the amount and type of data that will be stored in your MISP as well as the usage and automation patterns, but there are some universal recommendations that you can follow:
1.1 Storage
Storage type and performance are the most critical factors. HDDs or VMs running on shared disks are the most common performance bottlenecks we encounter and can severely impact an instance.
- Focus on IOPS rather than bandwidth
- Switching to an NVMe drive will have a bigger impact than other hardware upgrades
1.2 Memory
Memory plays a big role once your instance grows.
- MySQL or MariaDB will perform orders of magnitude better if the entire index fits in the InnoDB buffer pool.
- ~50% of your RAM should be dedicated to the innodb_buffer_pool_size if you have MISP on the same hardware as your DB
- ~75% of your RAM should be dedicated to it on dedicated DB servers
- MISP will happily run on 4GB of RAM, once data and the user count starts increasing, you will want to ramp up
- Systems with 8-32GB RAM for internal instances, 16-64GB for sharing communities are quite common.
1.3 Other
Generally while other factors can occasionally become limiting factors (such as woefully underpowered CPUs), but this is rare.
2 PHP and MySQL/MariaDB settings
You can View the diagnostics of MISP, which will give you a check-up on whether you reach the minimum recommended settings. Simply navigate to Administration -> Server Settings & Maintenance -> Diagnostics tab.
2.1 PHP settings
You can control memory envelopes, limitations on maximum posted data sizes as well as the maximum execution time an individual query can take.
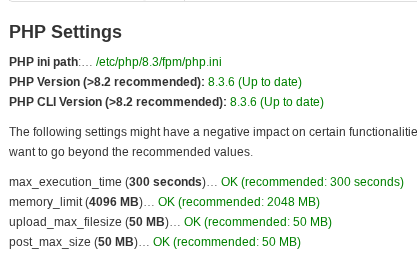
2.1.1 Memory limit
This setting can be a little bit deceptive, this limit is enforced on each individual php process, meaning that the theoretical maximum memory draw is memory_limit * concurrent processes.
MISP is designed to handle large workloads even on more modest memory envelopes. Extracting large data sets will be split into sufficiently small chunks to accommodate the available memory. This means that finding a good balance between overshooting what is actually required (and thereby risking memory exhaustion when too many concurrent processes fire at the same time). Generally memory limits between 2-4GB should cover most use-cases just fine.
2.1.2 Execution time
Increasing the execution time limit is a double-edged sword, while it may prevent extremely long running API calls from running into timeouts, it can also lead to higher memory usage as multiple concurrent processes compete for memory. It is recommended to set custom execution time limits for different use-cases. External users expected to occasionally
2.1.3 Post and upload max sizes
These two settings control the maximum request size as well as the maximum uploaded file size (when using the UI). Keep in mind that upload_max_filesize has to be at most the same size as the post_max_size. Raising these settings above the recommended limits is generally a good idea, individual events can become quite large, easily exceeding 50 MB, especially when we consider attachments.
2.1.4 Per user role settings
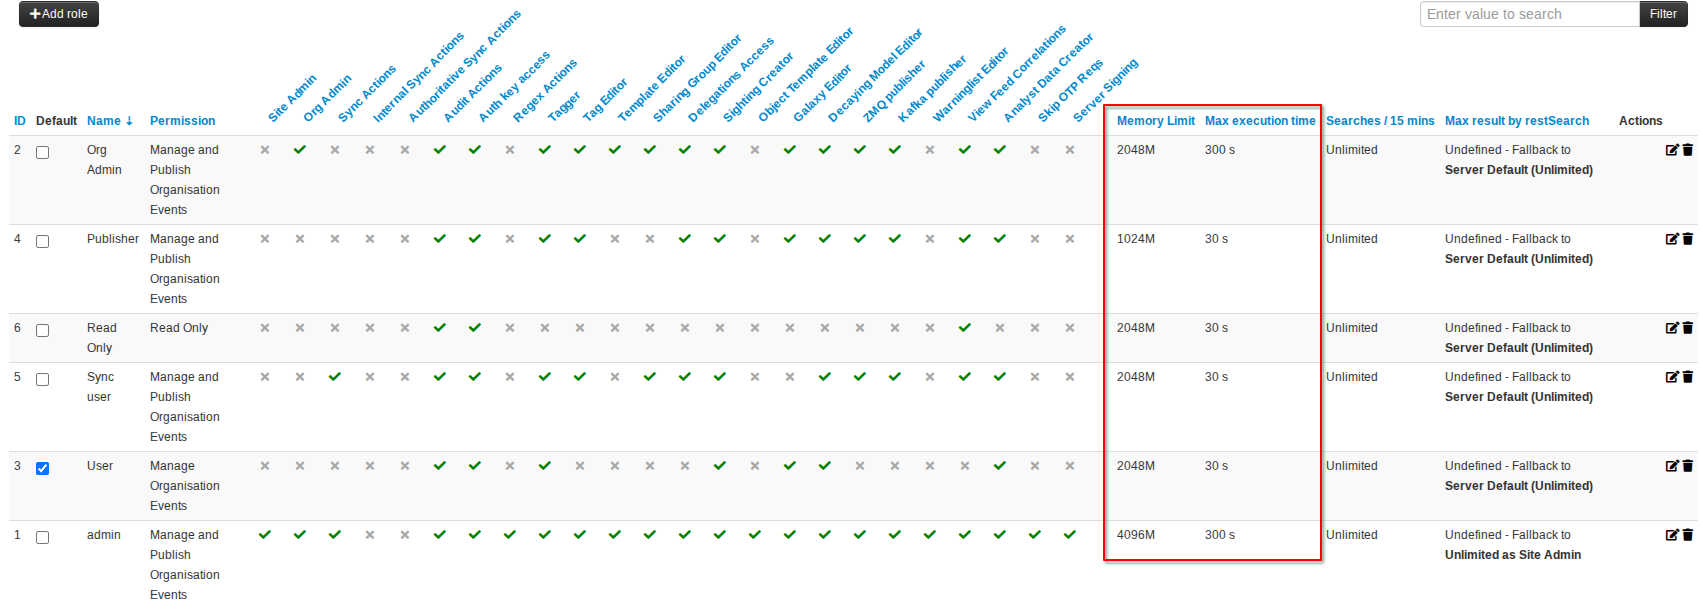
The above settings can be further refined on a role by role basis, by overriding the defaults in the role management. Feel free to customise roles based on needs:
- For example, having an internal API user used to feed your various protective tools getting additional resources made available over external interactive users makes sense.
- Sync users having a higher memory and execution time envelope can be helpful too when it comes to syncing large events.
2.1.5 Session handling

MISP instances installed in recent years will by default delegate the choice of session handler to PHP (as configured in php.ini). The default installation of PHP defaults to file sessions, which generally can lead to occasional logouts and incorrect timeout settings. It is HIGHLY recommended to switch to redis sessions in case it isn’t already configured (which could be the case for very old, gradually upgraded MISP instances), using the following two directives in php.ini (assuming the default redis installation):
session.save_handler = redis
session.save_path = 'tcp://localhost:6379'
2.2 Database settings
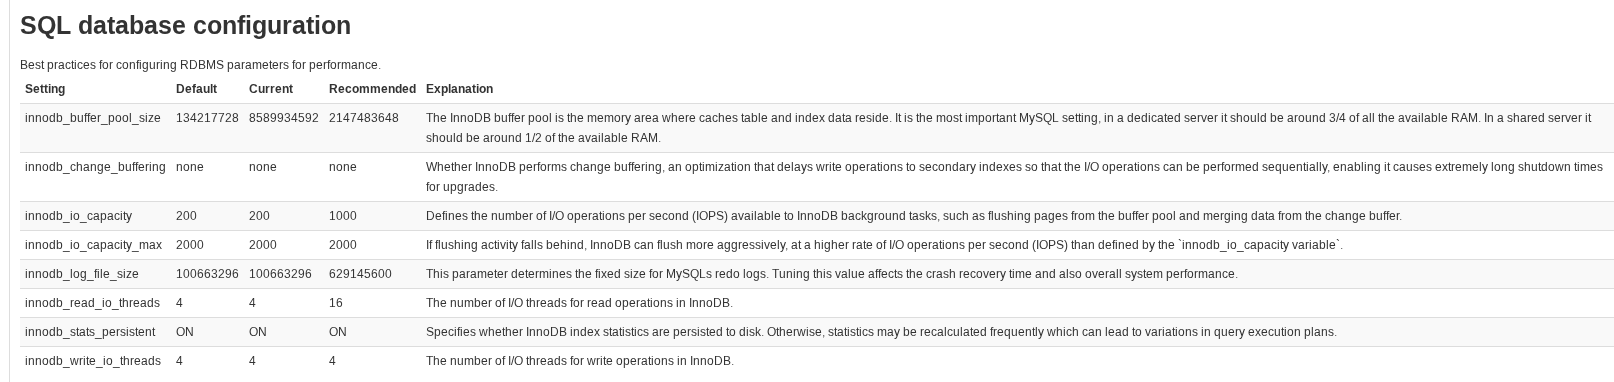
The database configuration tool provides thorough guidance on the settings, but keep in mind that even the recommended settings can be low in some cases for beefier instances. A large innodb_buffer_pool_size especially can make a dramatic difference. Make sure to set this to around 3/4 of your RAM if you are running a dedicated SQL server and to around 1/2 of your RAM if your MISP and SQL share a server.
3. Database management
3.1 Which database should be used?
MISP currently supports MySQL and MariaDB. It will certainly work with older versions of either flavour, however, it is HIGHLY RECOMMENDED to use as modern a version as possible, the improvements in the query planner can drastically influence the performance.
3.2 Choosing the right datasource
MISP allows for multiple datasource handlers, which can be configured in /var/www/MISP/app/Config/database.php:
- Database/Mysql: The default DB handler of the framework. Could still be used on some older, perpetually upgraded instances, slow with no additional logging features.
- Database/MysqlExtended: The original DB handler extended with functionalities improving the performance of the query builder.
- Database/MysqlObserver: The original DB handler with the addition of calling functionalities and user IDs are prepended to each query as a comment for easier debugging and auditing.
- Database/MysqlObserverExtended: The new default handler, it mixes the improvements of MysqlExtended with the verbosity of MysqlObserver.
4. MISP Settings
MISP’s behaviour and performance can be influenced by certain server settings. Keep in mind that the format of settings is {SCOPE}.{setting_name} with most scopes having their own tab in the server settings & maintenance interface. If a scope does not have their own tab, they can be found under the “Plugin” tab. Here’s a list of settings that have a potentially large impact on performance.
- MISP.correlation_limit: Configures how many correlations can be stored for each given value. Values that generate thousands of correlations for example are less useful.
- MISP.default_attribute_memory_coefficient: This setting controls the heuristics used by MISP to determine how large chunk sizes should be when handling large amounts of attributes (in attribute / MB). A larger number will attempt to be more aggressive with fetching larger chunks of data for faster performance, but increasing the risk of a chunk leading to memory exhaustion. In the rare case that you are receiving memory exhaustion from fetching attributes (meaning the internal pagination bit off more than it could chew), consider lowering this number slightly.
- MISP.default_event_memory_divisor: When loading events, we have to deal with some additional overhead on top of the attribute memory coefficient - encapsulating objects, attached galaxy clusters and so on via a divisor used to calculate an event’s weight.
- MISP.show{FEATURE}OnIndex: a set of settings that control additional aggregate information shown on the event index. This can often be the culprit for a sluggish event index on large instances, especially the
MISP.showCorrelationsOnIndexsetting can incur a performance hit in certain situations (highly correlating data-sets, use of theOn Demand Correlation Engine). - MISP.default_restsearch_limit: Optionally control how many results can be returned by restsearch. This can be overriden or configured on a role per role basis too. It can help rein in users repeatedly fetching large data amounts.
- MISP.block_old_event_alert and MISP.block_old_event_alert_age: MISP potentially handles the sending of a large number of alert e-mails, notifying users of new events. Skipping alert e-mails when an old event gets created can help block alert spams when a new synchronisation link starts ingesting a large historic data-set. From a performance perspective, this can make a large difference as MISP, depending on the settings, may be encrypting each individual e-mail.
- MISP.org_alert_threshold: Similar to the above setting, but it instead limits the number of rapid succession event alerts coming from the same organisation. This is useful to block the spamming of users in cases such as when a large collection of events is synchronised from a single organisation.
5. Benchmarking and debugging
5.1 The Benchmarking tool
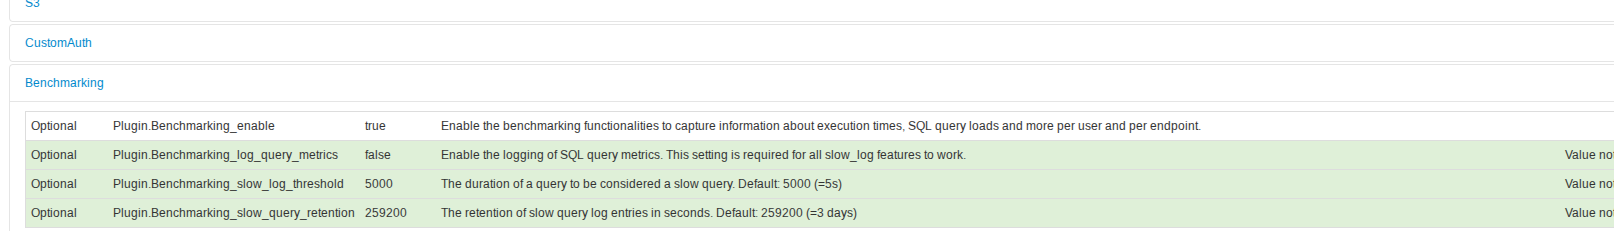
Enabled by navigating to Administration -> Server Settings & Maintenance -> Plugin tab -> Benchmarking accordion. This set of tools allows for the profiling of the incoming requests and their resource use by different pivot points.
To reach the benchmarking interface, once the functionality has been enabled (and allowed some time to collect useful data), it can be reached via Administration -> Benchmarking.
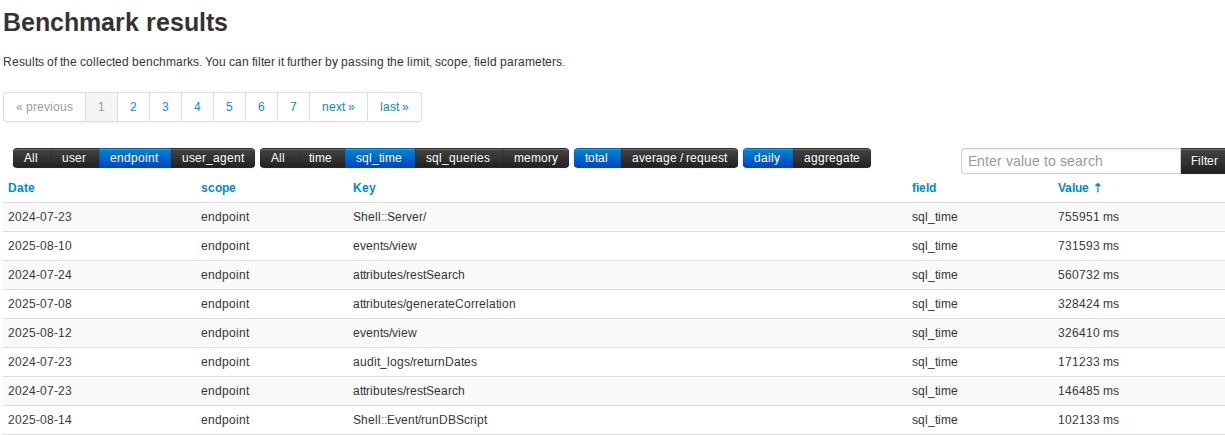
5.1.1 Controls
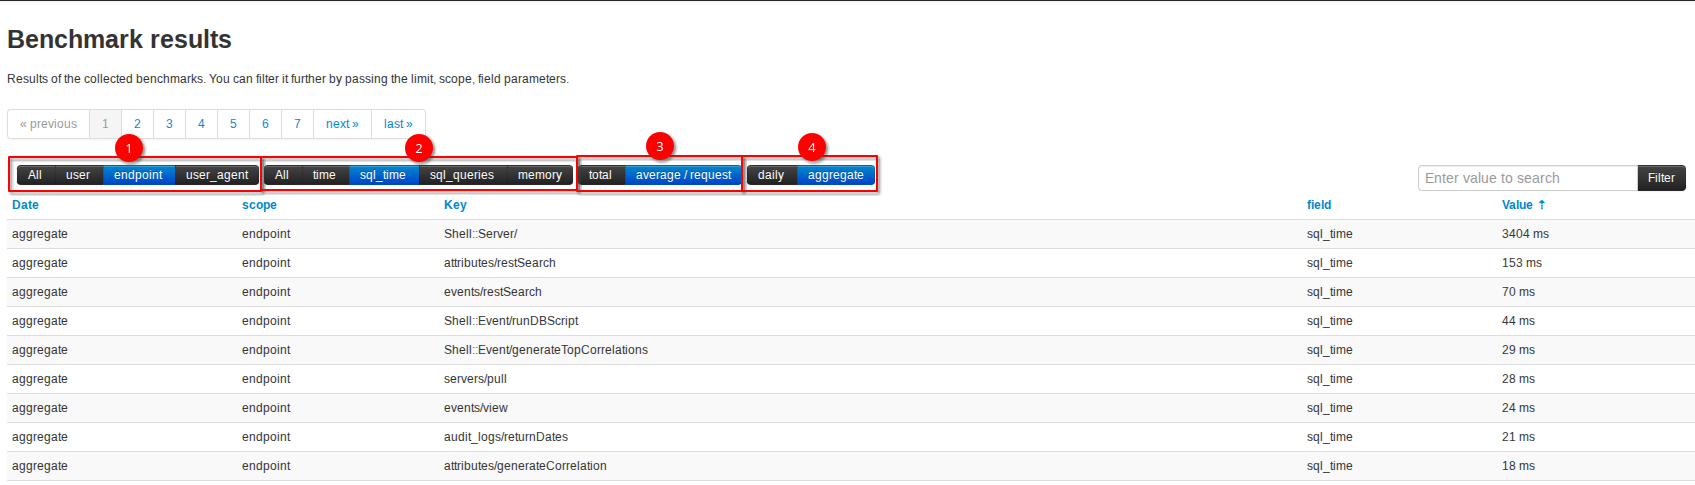
The main controls of the interface are the filter configurations in the left upper corner (marked 1 through 4), the pagination direction controls and the search box.
Scope
This controls how we want to group our benchmarking data. If we’re interested in users’ activities, we can set the scope to user and each element will be listed for each individual user.
Metric
The metric decides which type of resource use we’re interested in. time shows the full execution time of queries, sql_time limits this to purely the duration of the SQL queries. memory shows the amount of RAM in MB consumed by the matching processes.
Aggregation
Show aggregate values or calculate the average / request.
Timeframe
Do we want a daily split of the data or an aggregate? The daily data can be especially interesting when high resource use can be tied to a specific timeframe. Inconvenient, but it’s possible to set the actual dates to use for the dataset by passing the target dates as URL parameters, such as /days[]:2025-10-08. You can add multiple /days[] parameters for multiple considered dates.
5.1.2 Examples
Below are some common combinations, meant to serve as inspiration:
Total SQL time by user
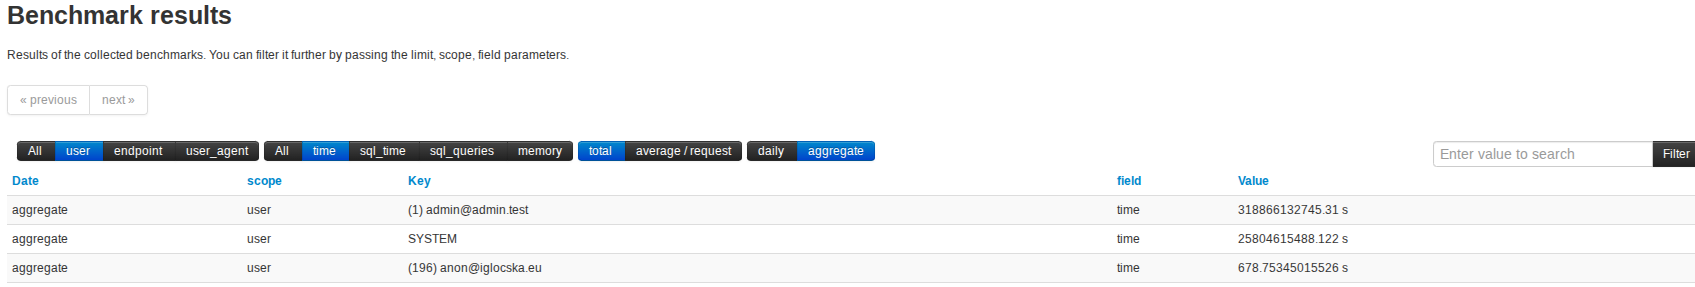
This would allow us to view which user is hammering us with queries that take up the most SQL time.
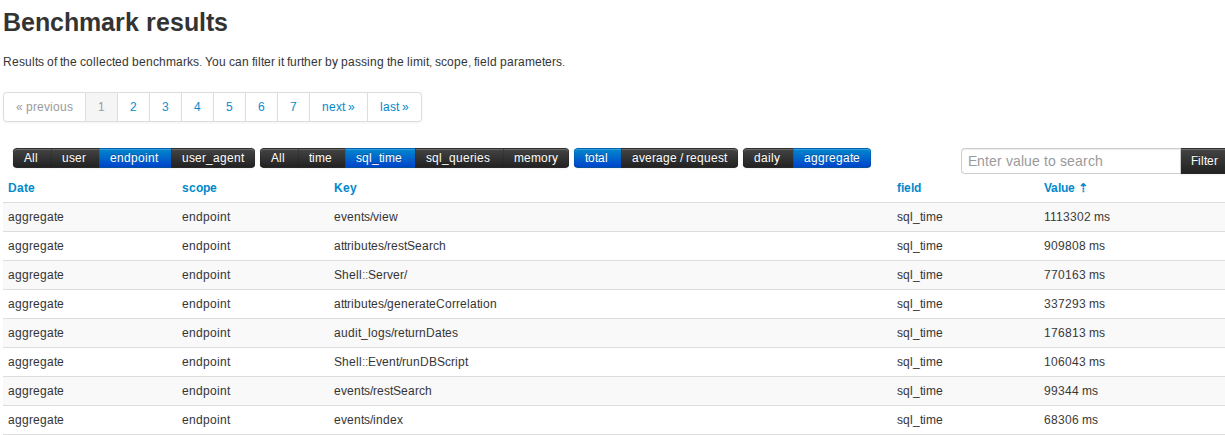
Average SQL time per endpoint
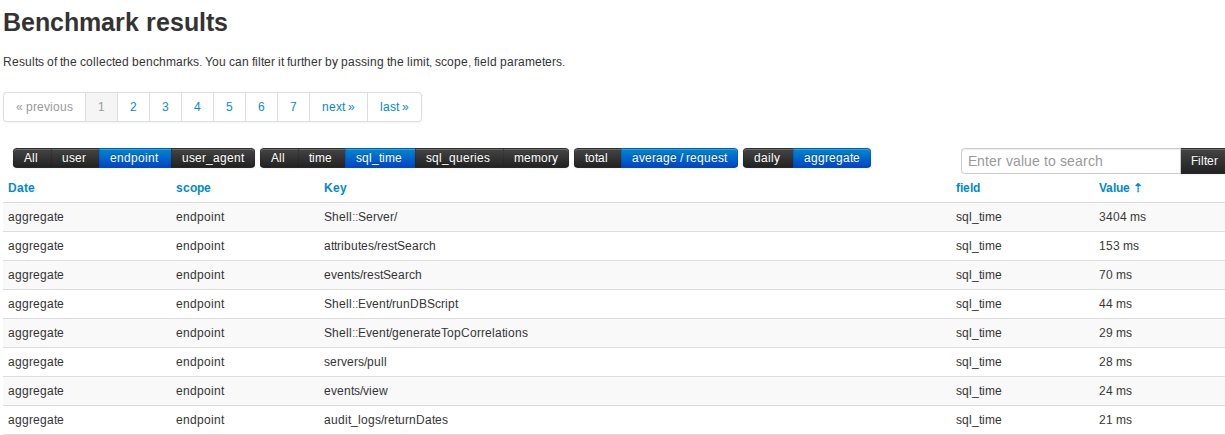
This can help identifying individual functionalities that are costing us the most resources. We may ask you to investigate both this and the overall SQL time spent for an endpoint during a debugging session.
Total time spent processing individual endpoints
Similarly to the above query this can be helpful in finding endpoints misbehaving (though in some cases longer processing times may be warranted by the nature of the endpoint).
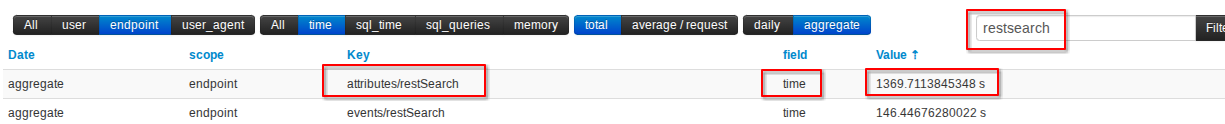
Figure out what percentage of the execution time spent on restsearch falls on mysql and on php
Total time:
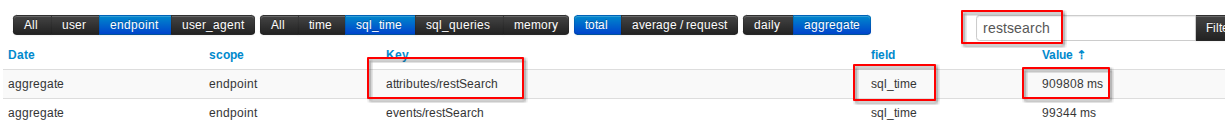
SQL time:
Total time: 1369.711s = 1369711ms
SQL time: 909808ms
PHP time: 1369711ms - 909808ms = 459903ms
Percentage SQL time: ~66.43%
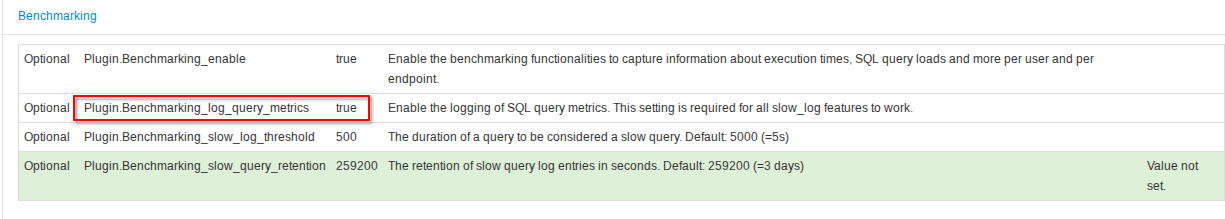
5.2 Slow query log
The slow query log allows administrators to specifically capture slow queries. Whilst this can be accomplished directly via mysql, the tool allows an endpoint specific searches. It needs to be enabled in the Benchmark plugin section.
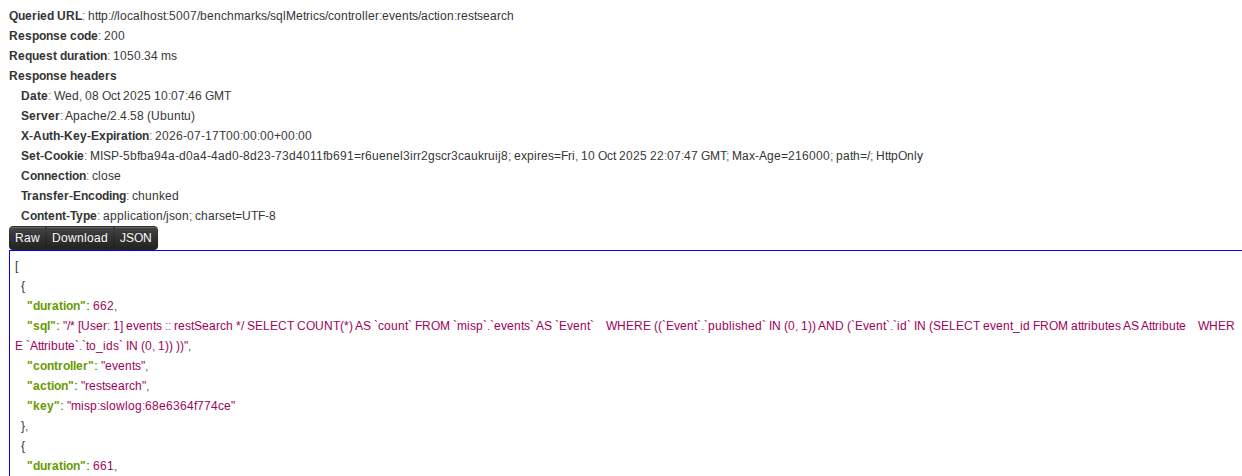
The results are currently only accessible via the API via the /benchmarks/sqlMetrics endpoint. By default, t will simply list all queries that took longer than the threshold defined in the settings.
An example, querying specifically for slow queries hitting the events/restSearch endpoint:
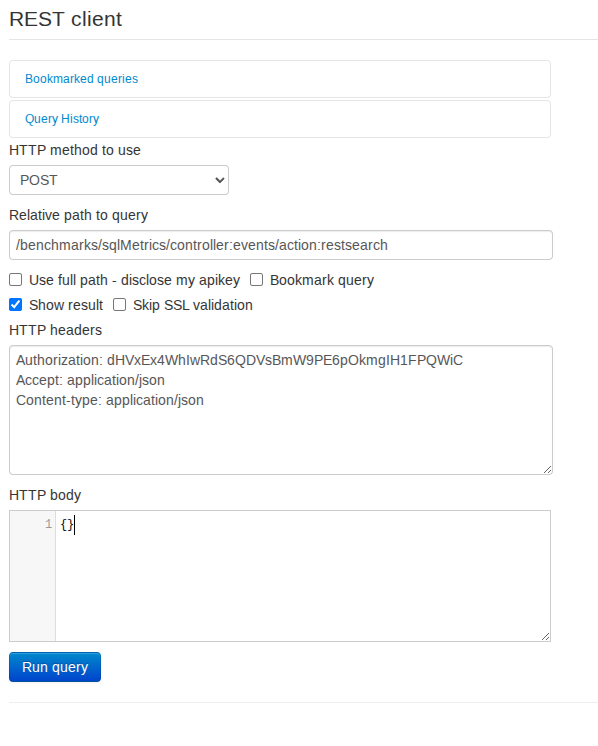
The resulting JSON contains the executed query and the duration. Since we’re using sql observer, we can also see the User ID in the query.
You could also query without any controller or action parameters to widen your search net.
6. Indexing
Since the bear’s share of the workload comes from retrieving and writing data from and to the database, the correct indexing of your database becomes absolutely crucial.
MISP is designed to run on a wide range of systems (from dedicated high performance servers all the way to the smollest potato), the MISP setup comes with a basic indexing schema that can be sub-optimal, especially if run on a higher end server.
The MISP shell scripts include a package meant to remedy this issue. To view the available scripts, simply run /var/www/MISP/app/Console/cake Admin runDBScript, which will list the available options.
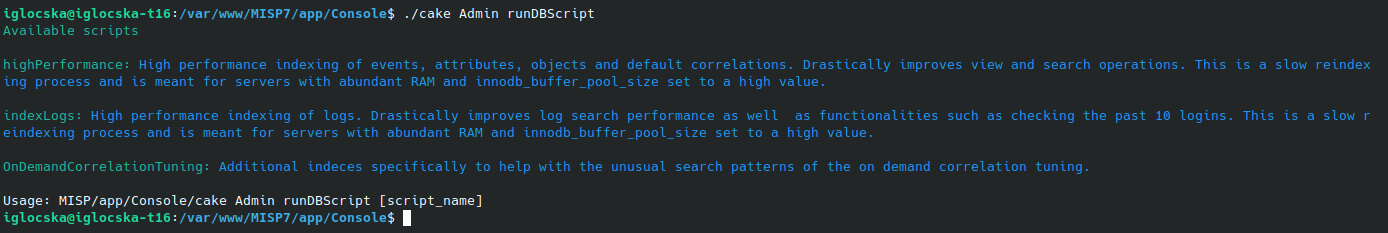
6.1 High performance Indexing
/var/www/MISP/app/Console/cake Admin highPerformance in particular is meant to improve performance dramatically, assuming you are not constrained by a low memory system. It will in particular reindex the main data tables (attributes, events, objects, correlations, etc.). It is re-run safe and will over time see changes to what exactly gets indexed, making it a habit of running the script is considered good practice.
Scripts that detect no required changes to be made finish instantly.
6.2 Audit log indexing
By default, The logs in MISP are not indexed, making searches extremely costly. However, this was considered to be the lesser evil when deciding which indeces to omit for lower specced servers, especially for instances that are not used as sharing hubs, but rather as local tools and thus require less auditing.
If being able to actively search the logs is desired, the additional indeces can be enabledby using the above mentioned runDBScript with the indexLogs parameter:
/var/www/MISP/app/Console/cake Admin indexLogs
7. General tips for building data-sets that are manageable
With all of the technical advice discussed so far, the possibly most impactful way to influence MISP’s performance is how it is being used. This section aims to provide some generic pointers.
7.1 Synchronisation
One of the core features of MISP is the sharing aspect, driven by the synchronisation functionality. However, setting up a new synchronisation link unfiltered can lead to the situation where a low spec MISP instance tries to ingest the full dataset of a large community, leading to some performance challenges. In the case of CIRCL, this can mean a large thriving sharing community that has been sharing high volumes of data since 2012.
To combat this, MISP offers various tools that allow to manage what gets synchronised.
7.1.1 Synchronisation filters
Synchronisation filters achieve more than merely restricting the flow of data, it can also be a powerful tool to manage the dataset that will be pulled in based on relevancy. For example, when configuring a synchronisation connection with an instance that has 13 years worth of data, it may be prudent to restrict the data-set to anything published in the past year for example, when dealing with a performance constrained server.
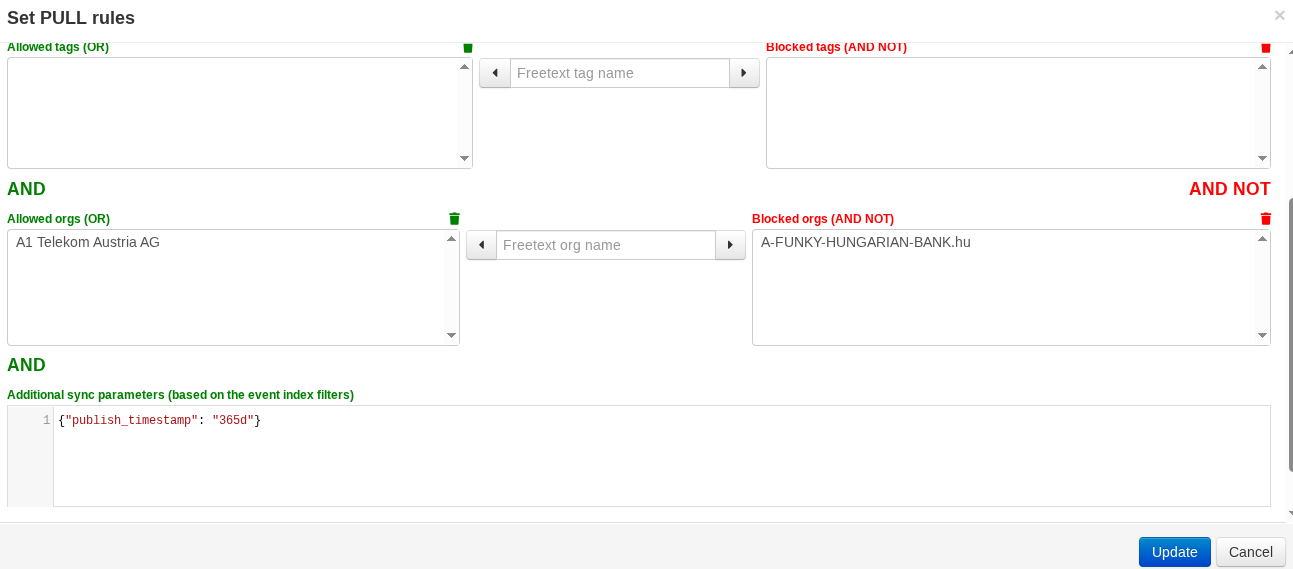
7.1.2 Previewing the filters
Once the filters are configured, the Test pull Rules button will check what the current filters would result in terms of pulled dataset.
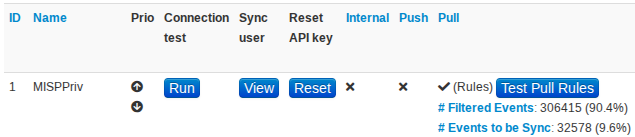
In the above example, 9.6% of the data would get pulled and 90.4% would be filtered out.
7.1.3 Previewing a remote instance
Remote instances can be previewed, to gauge the tags, producers, volume of data, their age or simply to browse individual events that might be of interest and manually pull those specifically in.
7.2 Feeds
Besides configuring the synchronisation rules, the ingestion of feeds can be equally important. MISP offers two different ways of interacting with feeds, one can either “fetch” or “cache” feeds.
Fetching a feed will create local events, attributes and objects out of the contents of the feed, whilst caching will extract and hash all values and store it locally in redis as a lookup table. This will allow for quick pivoting to the relevant feed’s contents when a correlation is found as well as opening the feed up to be searched using a locally cached version.