

Create a daily threat briefing with zsazsa and MISP
Create a daily threat briefing with zsazsa and MISP
Introduction
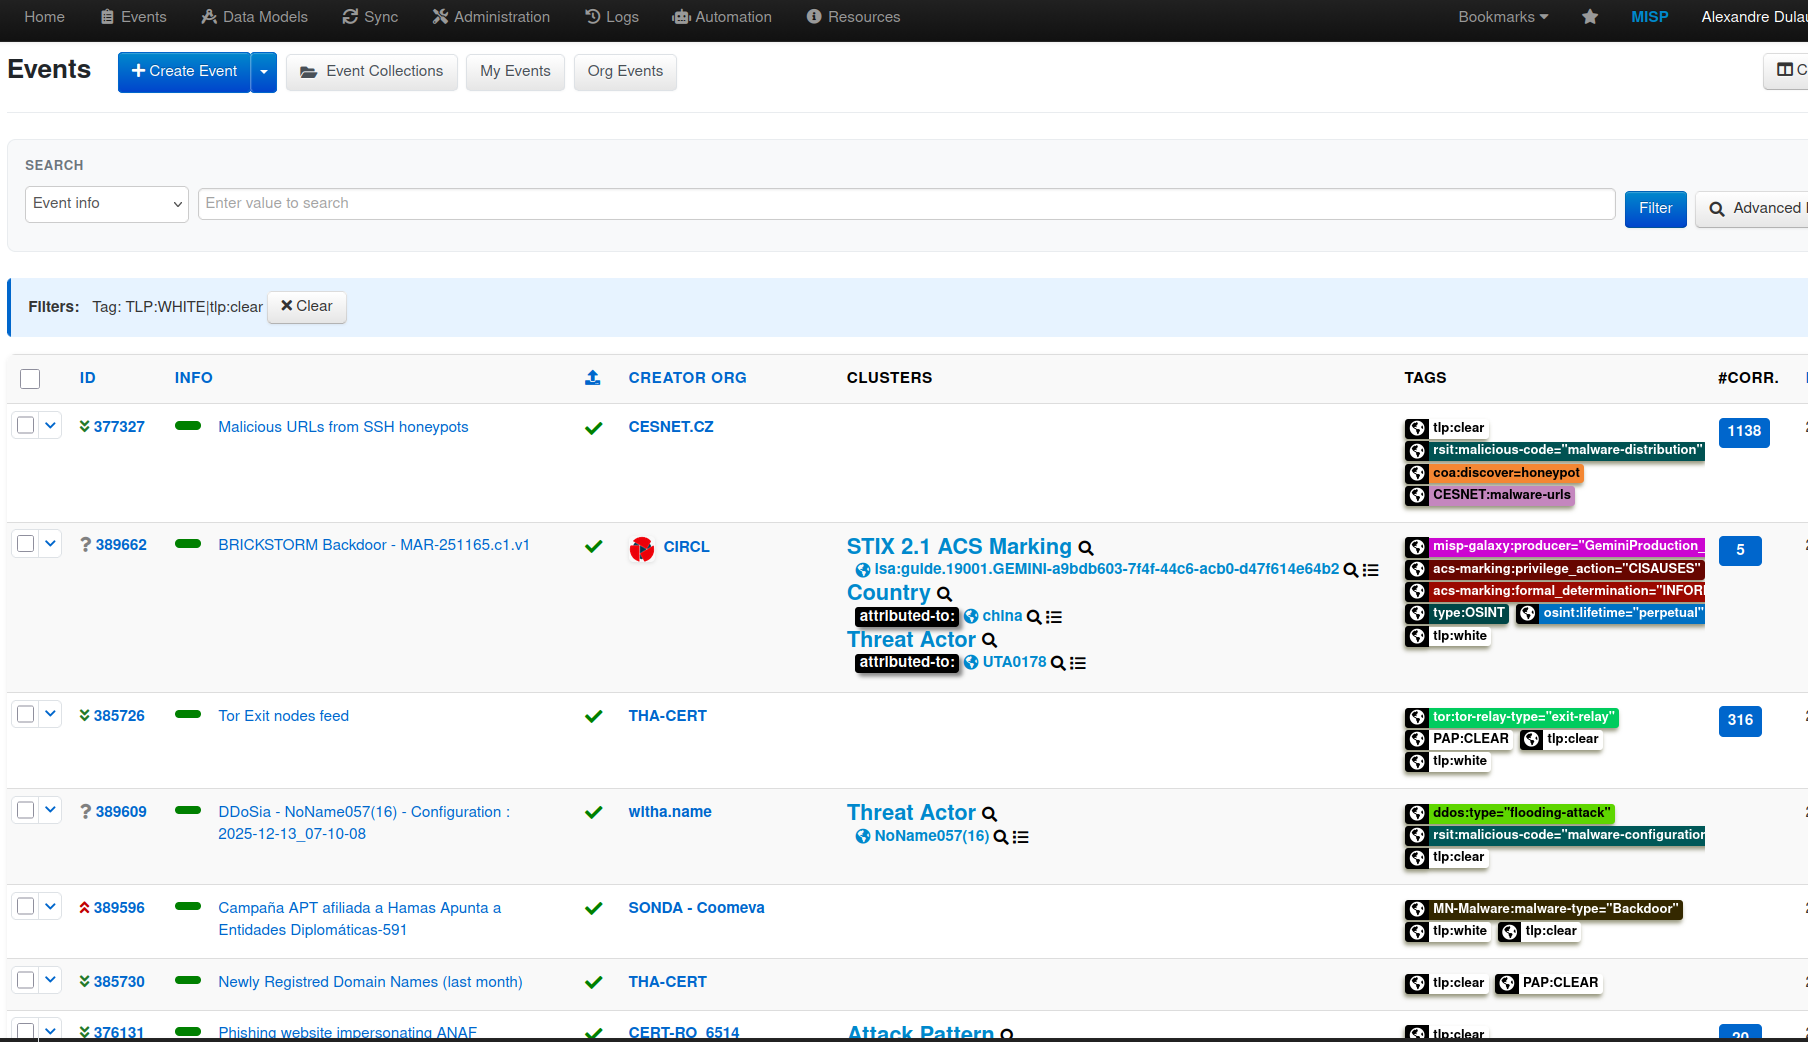
zsazsa is a small application that supports day-to-day CTI work, including stakeholder management, handling PIRs, GIRs and RFIs, data collection, and the creation of threat intelligence products. No external tooling is required, MISP acts as the back-end storage layer. Events, reports, and the final intelligence products are all stored in MISP. A nice side effect is that those products are not limited to the usual notification channels like Mattermost or Teams; they can also be shared through the standard MISP sharing and distribution model, in the same way as threat events. You can find zsazsa on GitHub: https://github.com/cudeso/zsazsa/.