


| April 17, 2025
MISP reporting
Introduction
MISP already offers several ways to examine what is happening on your instance:
- Statistics page - available via Global Actions ▸ Statistics – shows headline figures for events, attributes, users, organisations and sightings. (Tip: append
.jsonto the URL to retrieve the raw data.) - Dashboard plug‑ins - provide live widgets on usage, trending attribute values and popular tags.
- Periodic summary - delivers a snapshot of recent activity straight to your inbox.
- Visualisation in PowerBI - uses PowerBI to visualise MISP data.
These tools are invaluable for quick checks, yet they stop short of answering a few questions:
- How are events and attributes trending over weeks or months?
- Which key organisations are driving those trends?
- Which TTPs are most often linked to the incoming events?
- Which events still need curation and should be prioritised?
MISP reporting attempts to fill this gap.
What is MISP reporting?
MISP reporting lets you explore the threat information stored in your MISP instance. It provides an overview of
- the trend in the volume of events and attributes
- the distribution of attribute types
- recent activity by key organisations
- threat level and TLP classification of events
- targeted geographies and sectors
- TTPs used by threat actors
- vulnerabilities and weaknesses referenced in threat events
MISP reporting queries your instance, summarises the data, and outputs HTML reports together with a JSON statistics file. The generated graphs can also be embedded in other reporting tools.
MISP reporting is available on GitHub at https://github.com/cudeso/misp-reporting
Setup
MISP reporting is written in Python and requires a MISP API key.
Because the web server must read and write the files, ownership must be set to the web‑server user. On Ubuntu this user is www-data; on Red Hat it is apache. Run the following commands as the appropriate user (replace www-data with apache on Red Hat).
Step 1: Create the reporting directory and clone the repository
Custom MISP scripts are best placed in a dedicated directory such as /var/www/MISP/misp-custom/. Create it if necessary and clone the project.
sudo -u www-data mkdir /var/www/MISP/misp-custom/
sudo -u www-data git clone https://github.com/cudeso/misp-reporting.git
cd misp-reporting
Step 2: Set up a Python virtual environment and install dependencies
To keep system packages untouched, create a dedicated virtual environment named venv. If virtualenv is unavailable you may use python3 -m venv venv.
sudo -u www-data virtualenv venv
sudo -u www-data pip install -r requirements.txt
Step 3: Configure the application
Copy the default configuration and edit it to suit your environment.
sudo -u www-data cp config.py.default config.py
At a minimum you must set
- misp_url – the URL of your MISP instance
- misp_key – an API key (ideally for an account with the admin role)
- output_dir – where reports will be written
- install_dir – where MISP reporting is installed
Step 4: Create the output directories
Reports are written to output_dir, usually /var/www/MISP/app/webroot/misp-reporting. The directory must also contain a copy of the assets folder, which holds the logos of key MISP organisations.
sudo -u www-data mkdir /var/www/MISP/app/webroot/misp-reporting/
sudo -u www-data cp -r /var/www/MISP/misp-custom/assets /var/www/MISP/app/webroot/misp-reporting/
chown -R www-data:www-data /var/www/MISP/app/webroot/misp-reporting/
Step 5: Add your organisation’s logo
Copy your logo (and those of other key organisations) into the assets directory:
sudo -u www-data cp logo.png /var/www/MISP/app/webroot/misp-reporting/assets/
Step 6: Run the reporting script
Generate the reports:
sudo -u www-data /var/www/MISP/misp-custom/misp-reporting/venv/bin/python /var/www/MISP/misp-custom/misp-reporting/reporting.py
The reports are now available at https://<MISP>/misp-reporting/.
Cronjob
To run the report daily, add a cronjob for the web‑server user:
crontab -u www-data -e
Insert the following line (adjust the path if required):
00 6 * * * cd /var/www/MISP/misp-custom/misp-reporting/ ; /var/www/MISP/misp-custom/misp-reporting/venv/bin/python /var/www/MISP/misp-custom/misp-reporting/reporting.py
Reports
Three report types are planned. The summary and curation overview are complete; infrastructure monitoring is in progress.
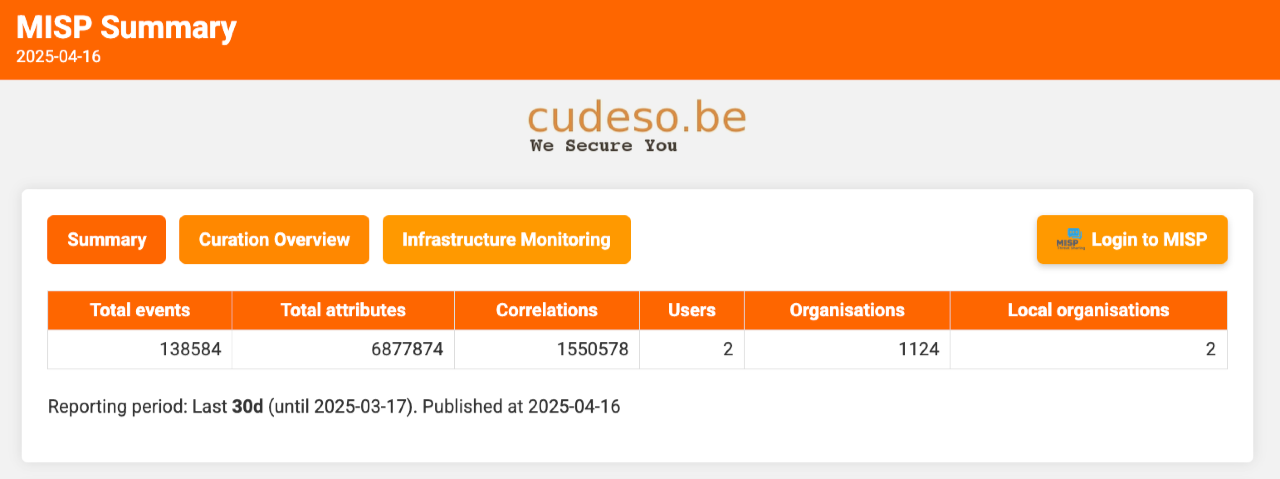
Summary report
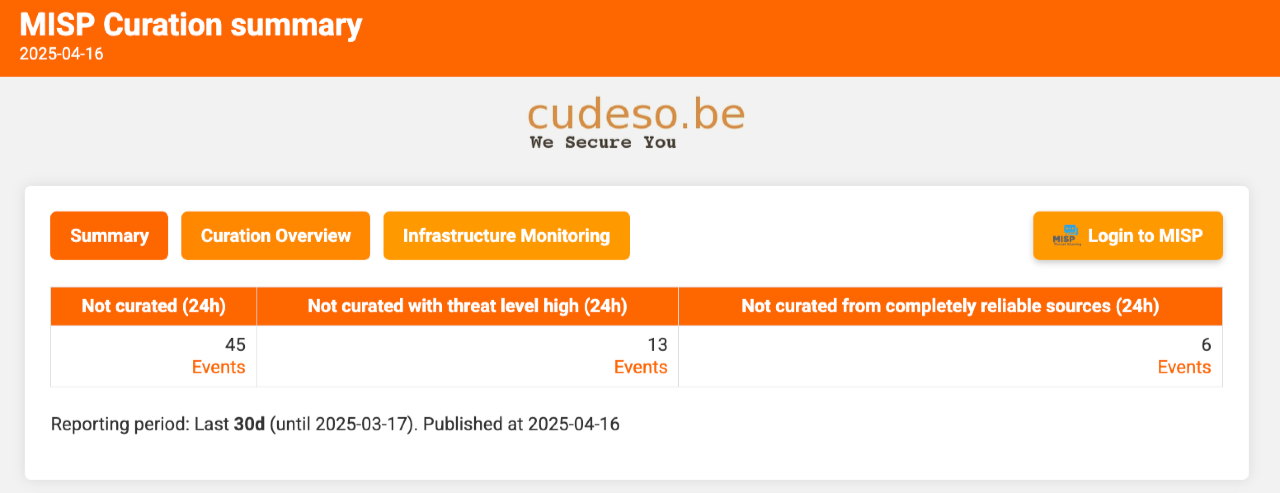
The summary report presents high‑level statistics for your MISP server. The header also links to the other reports and provides a button to log in to MISP.
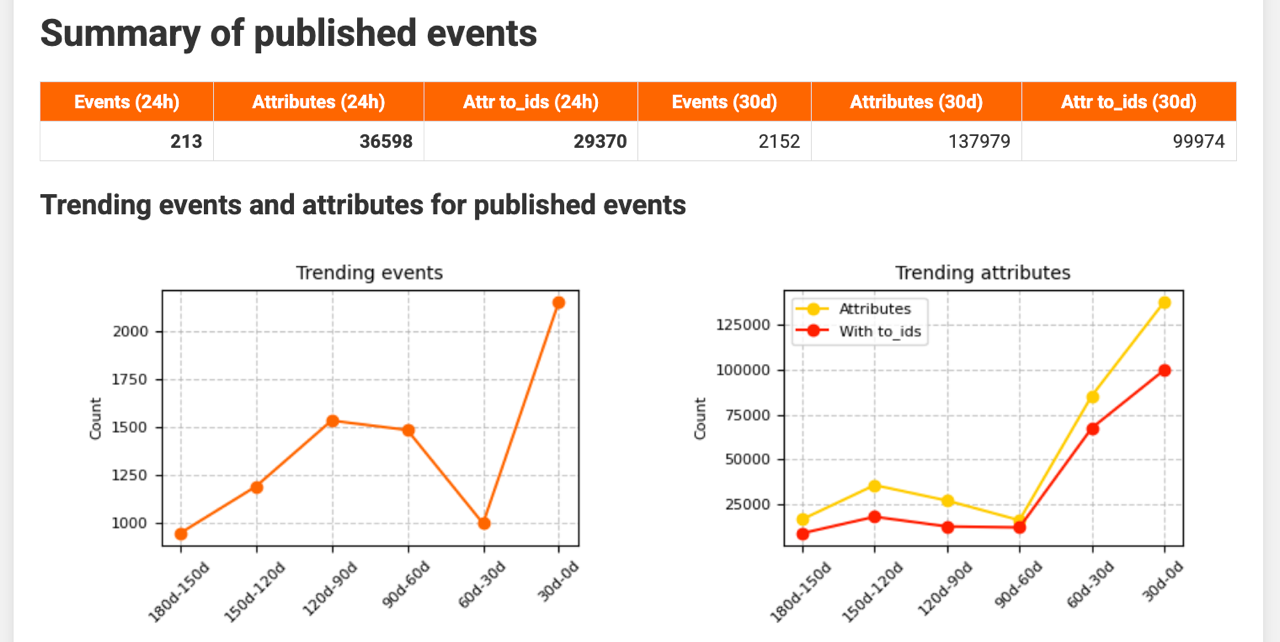
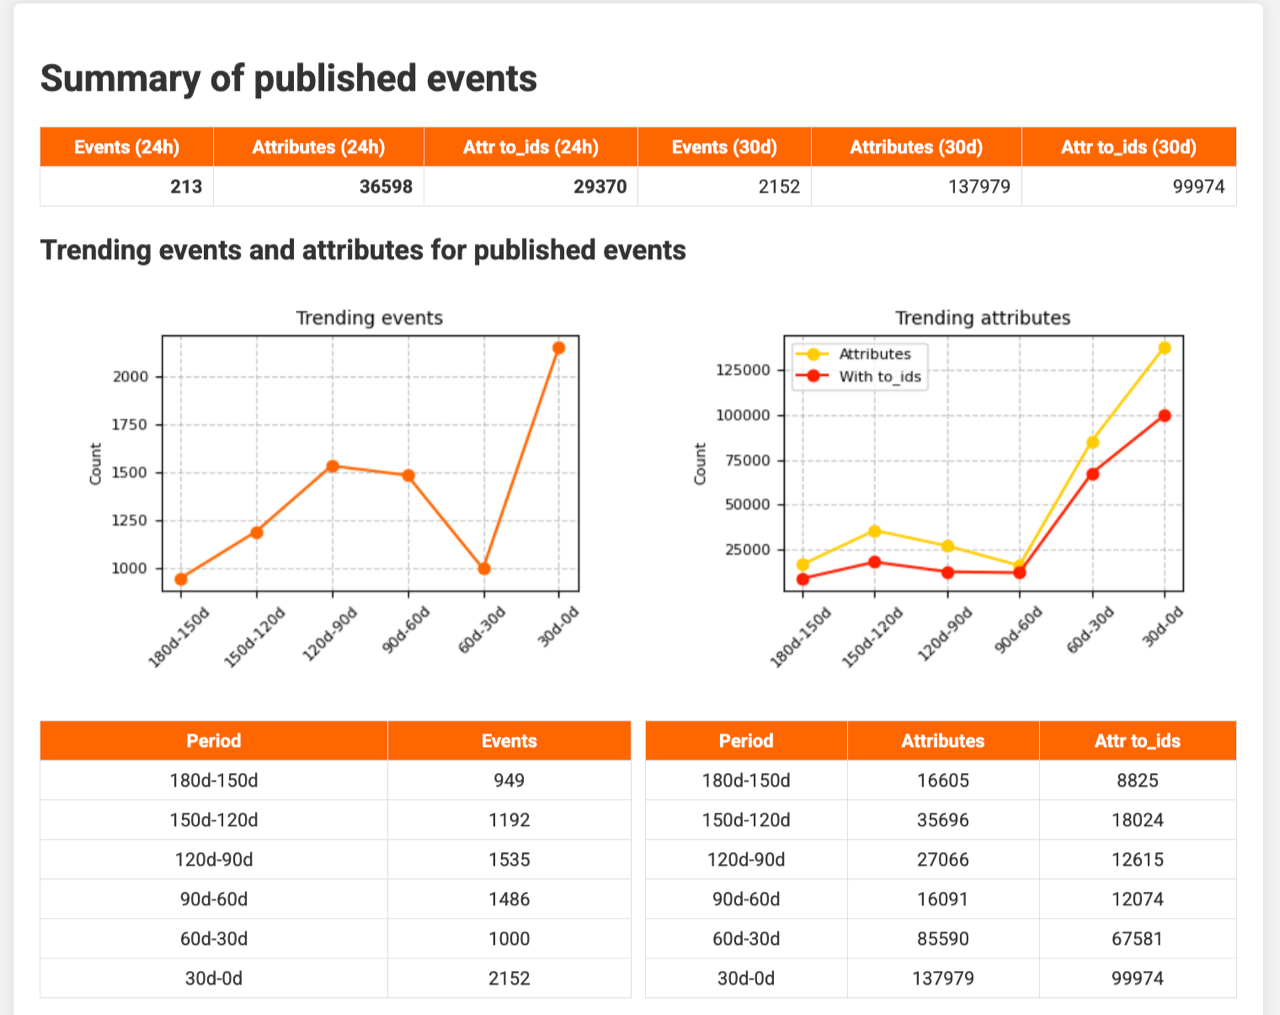
It begins with a summary of published events. Based on reporting_period, reporting_trending_count, and reporting_filter, you see the trend in published events and their attributes.
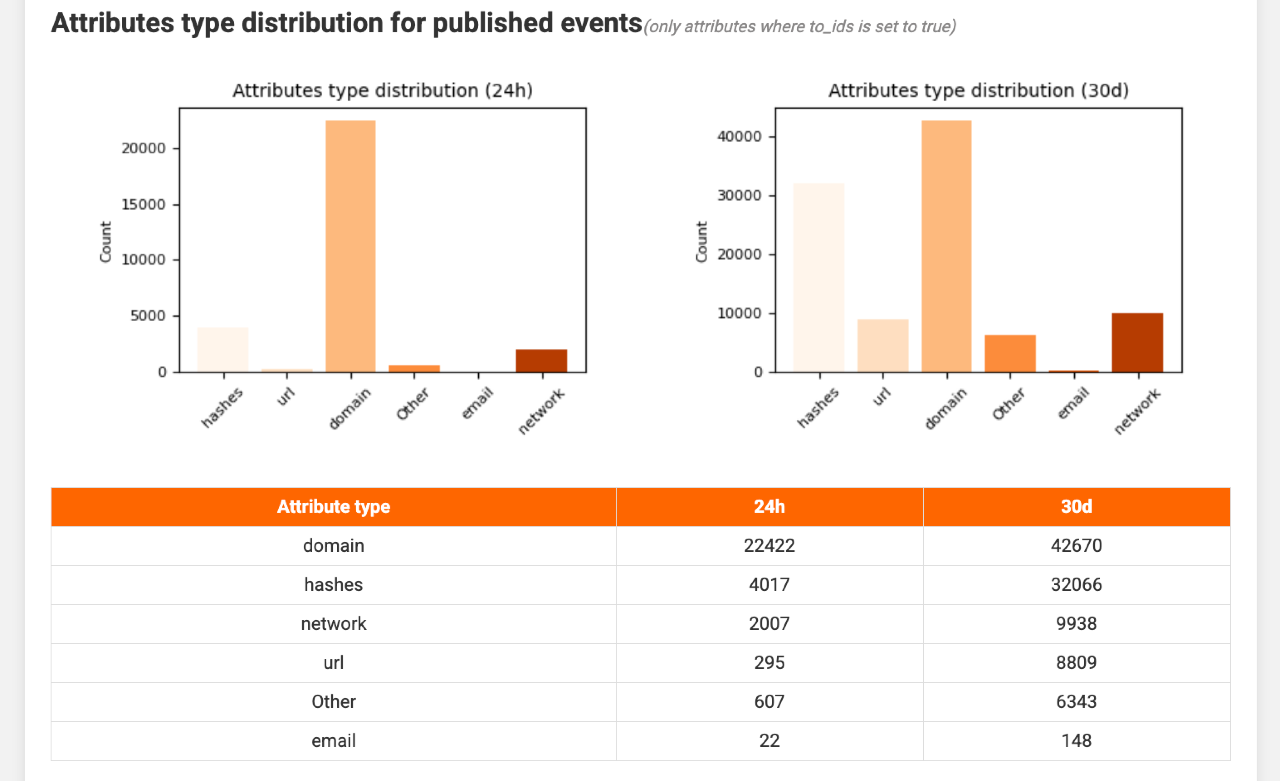
The next section examines attribute details, showing which attribute types appeared during the last 24 hours and other periods. The breakdown is controlled by attribute_summary.
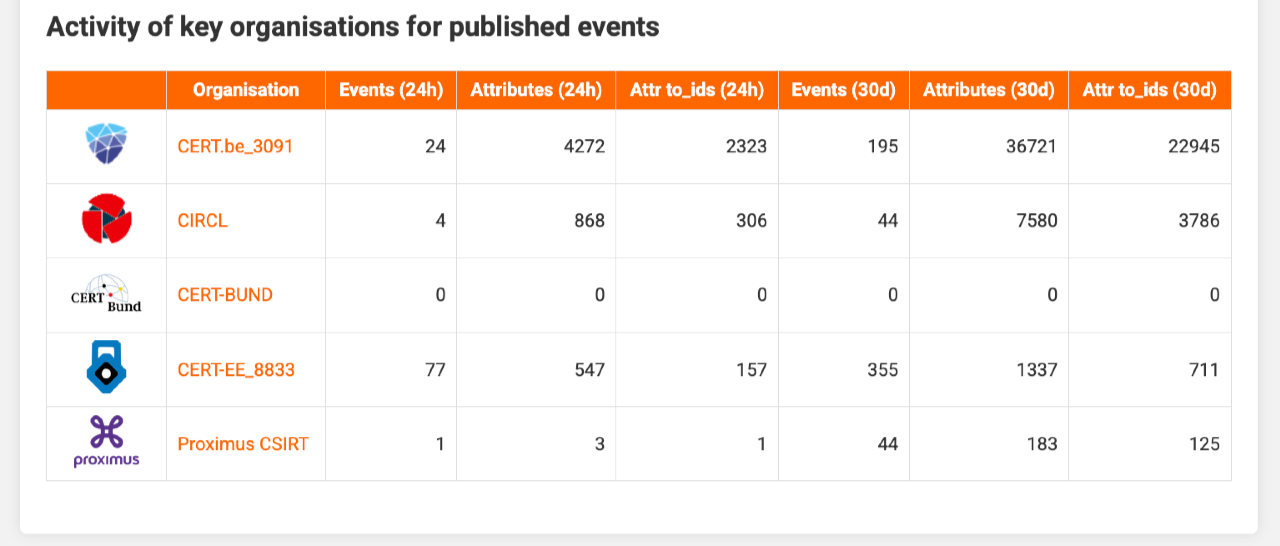
A further section highlights key organisations (defined in key_organisations), listing event and attribute counts for the past 24 hours and the current reporting period. Direct links open the corresponding events in MISP.
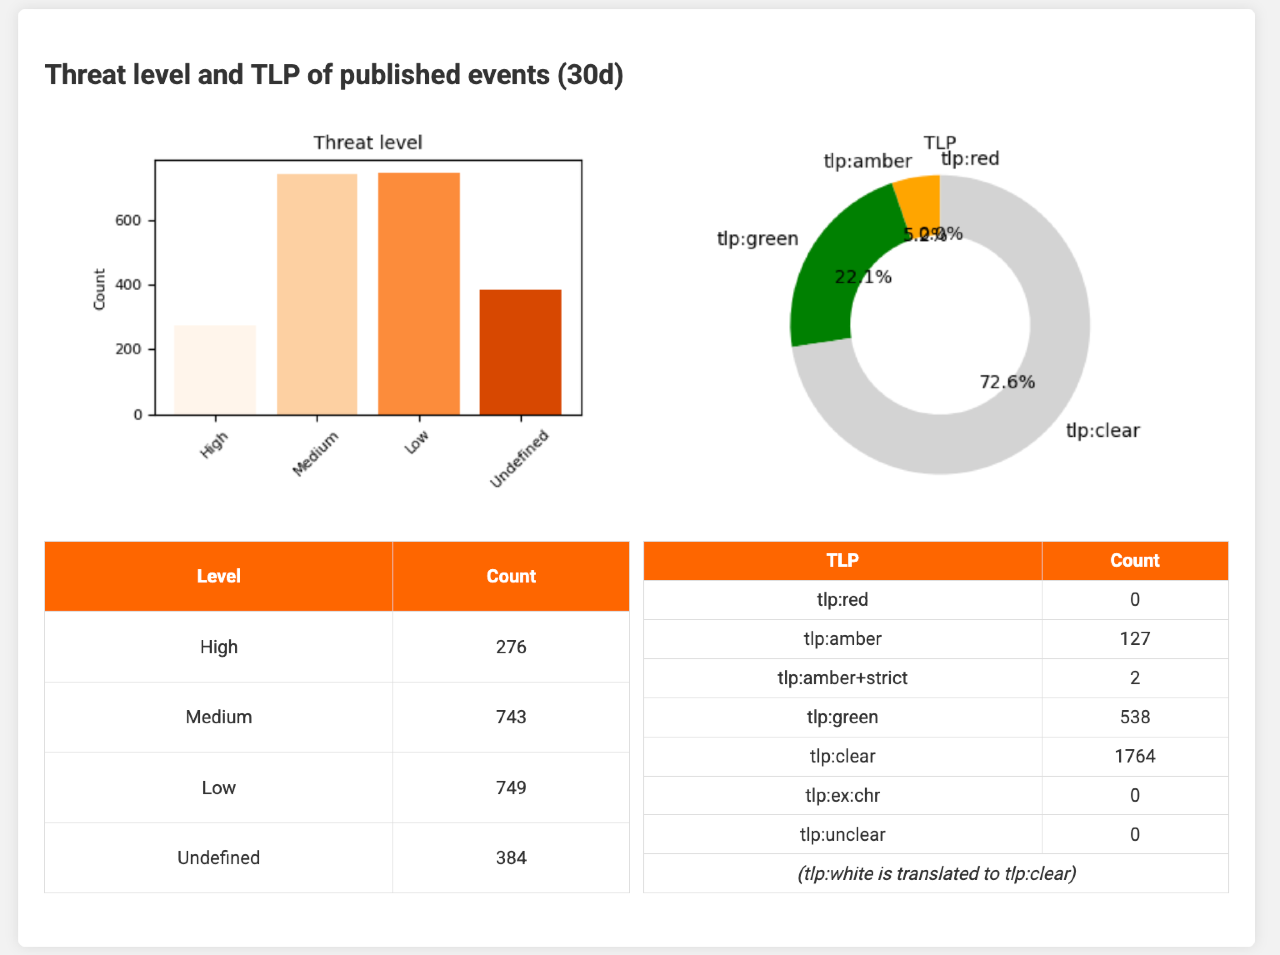
Threat level and Traffic Light Protocol (TLP) designations follow, enabling you to spot spikes in high‑severity or specific TLP‑tagged events at a glance.
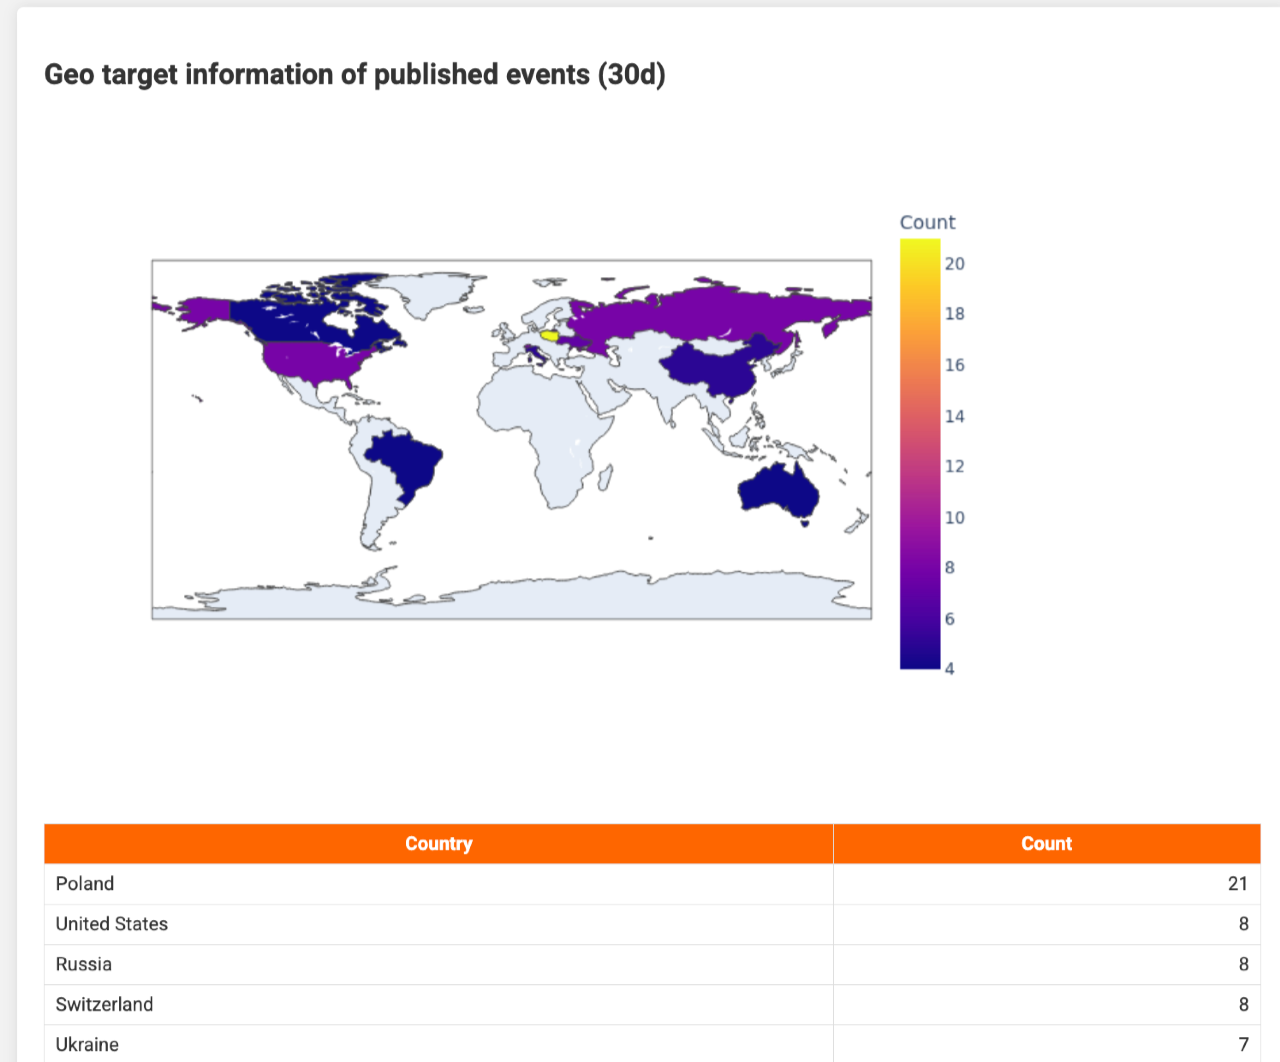
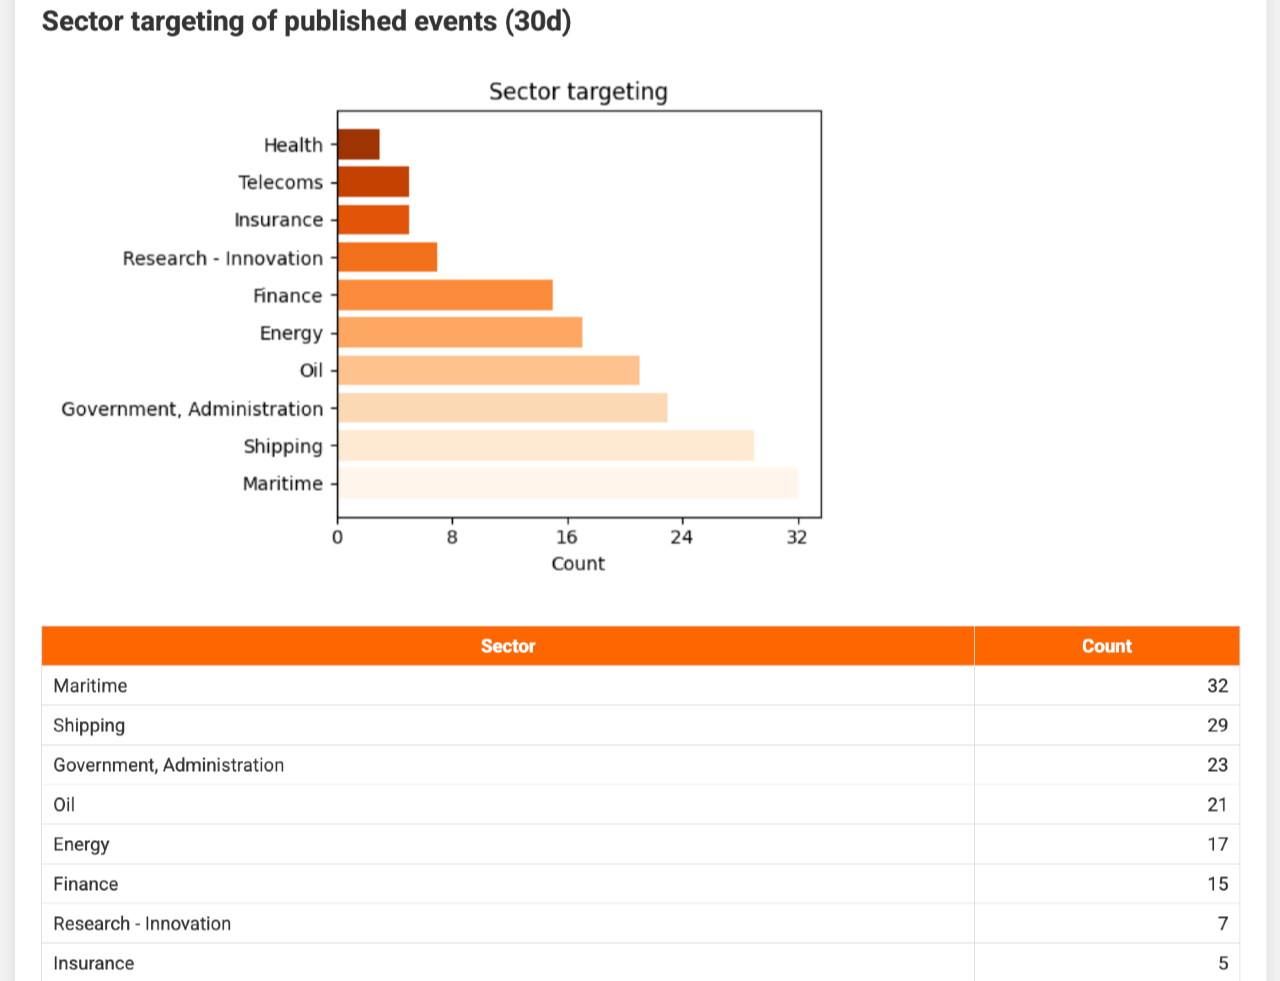
Two charts then show which countries or regions were targeted and which sectors were attacked, using galaxy tags set in filter_geo and filter_sector.
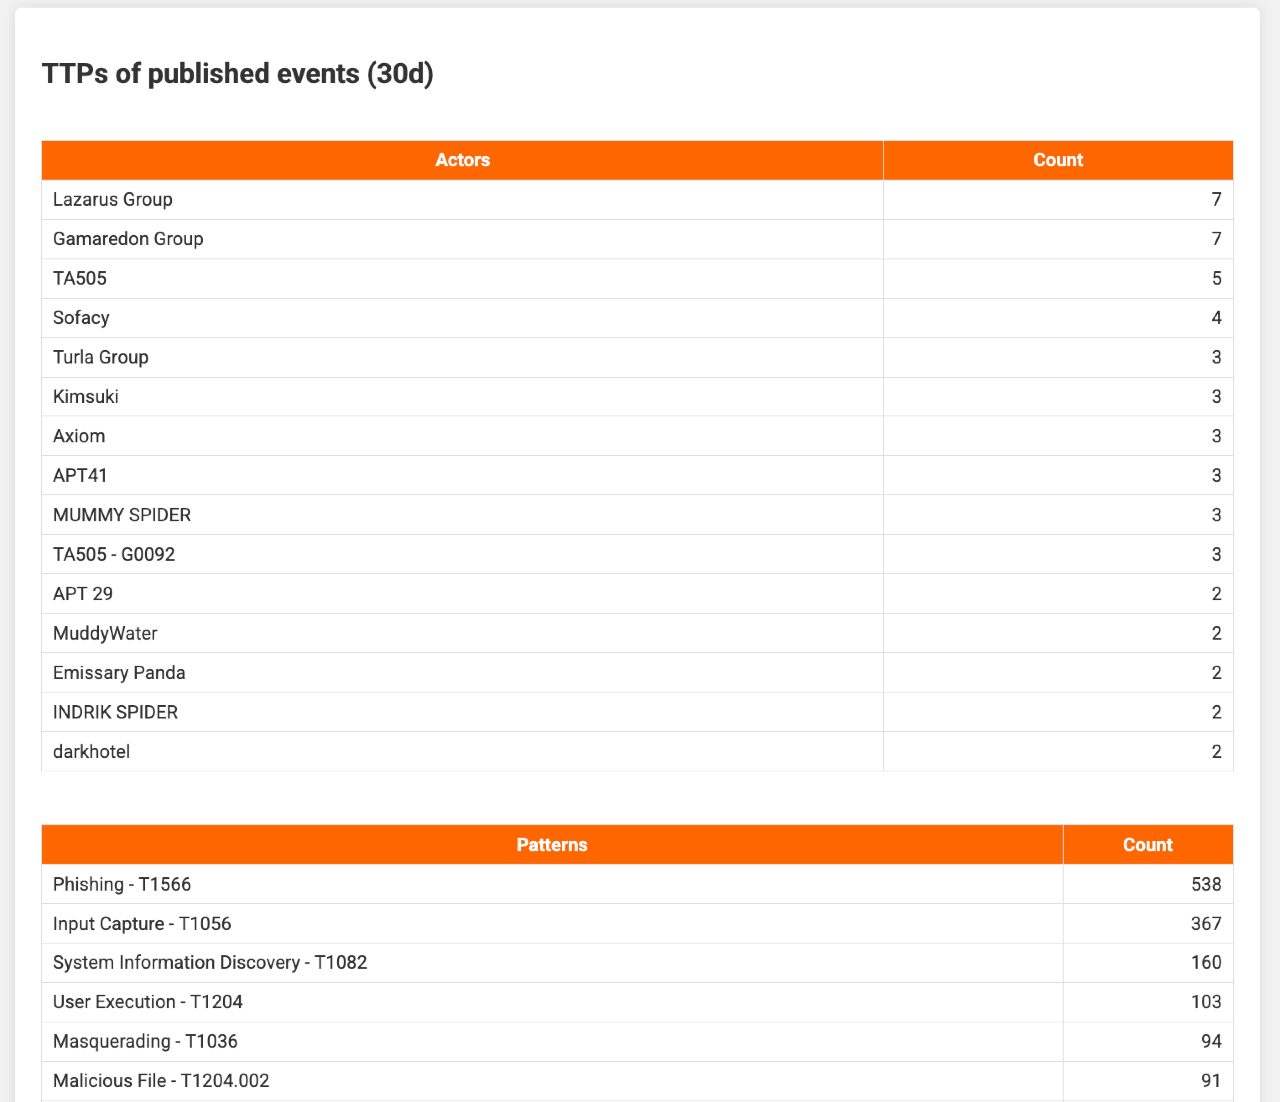
Similarly, threat actors (filter_ttp_actors) and attack techniques (filter_ttp_pattern) are listed.
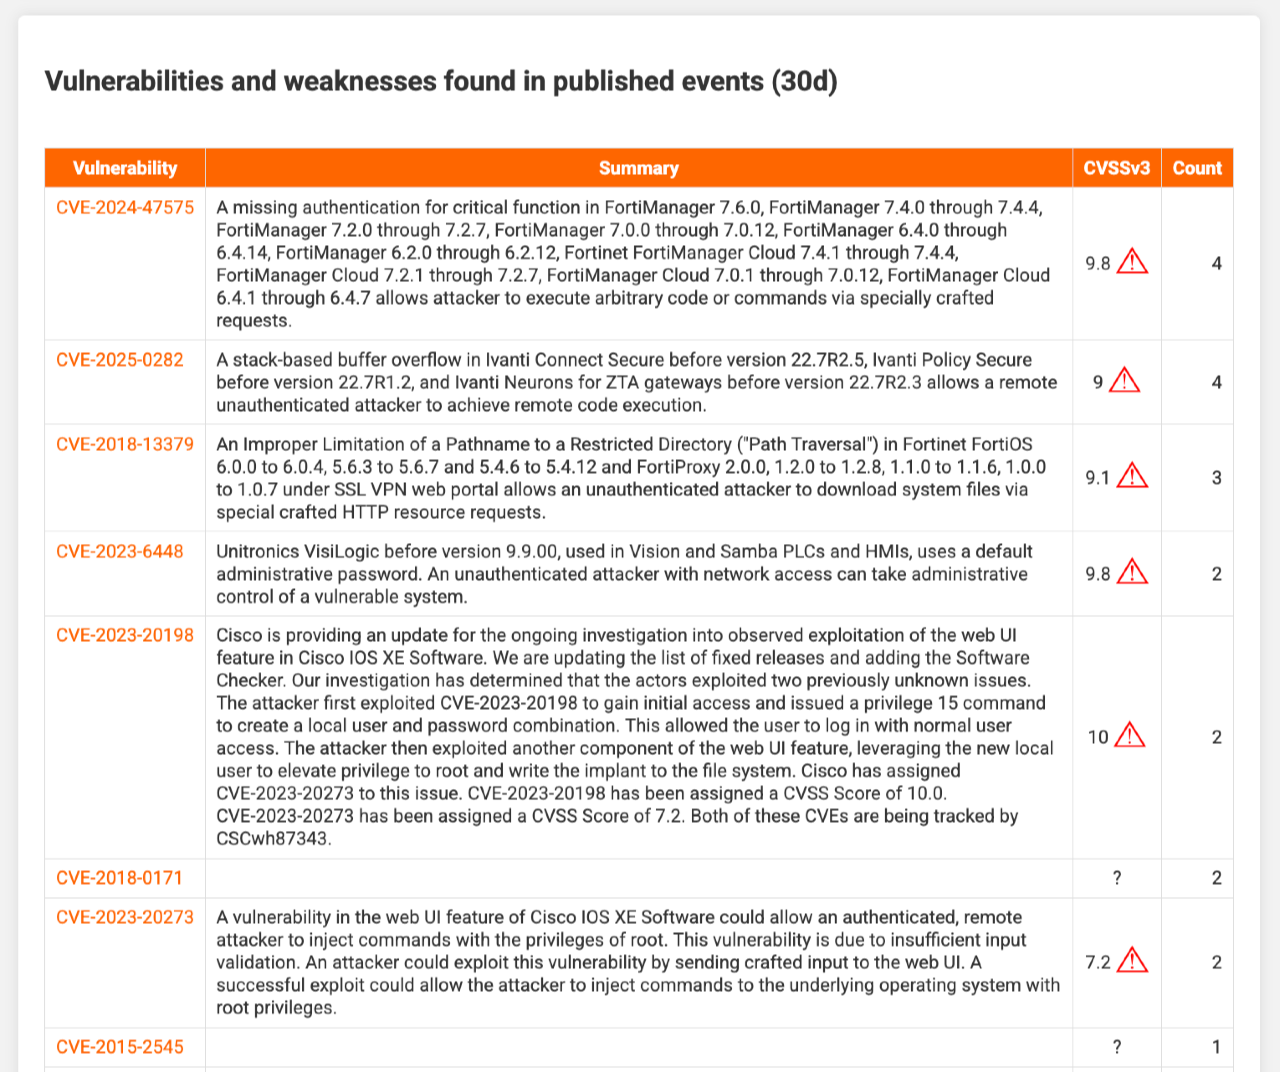
Finally, the report summarises all CVEs referenced in events. Additional details, such as descriptions and CVSS scores, are retrieved from cvepremium.circl.lu (cve_url). CVEs above the threshold set in reporting_cve_highlight are emphasised.
Curation report
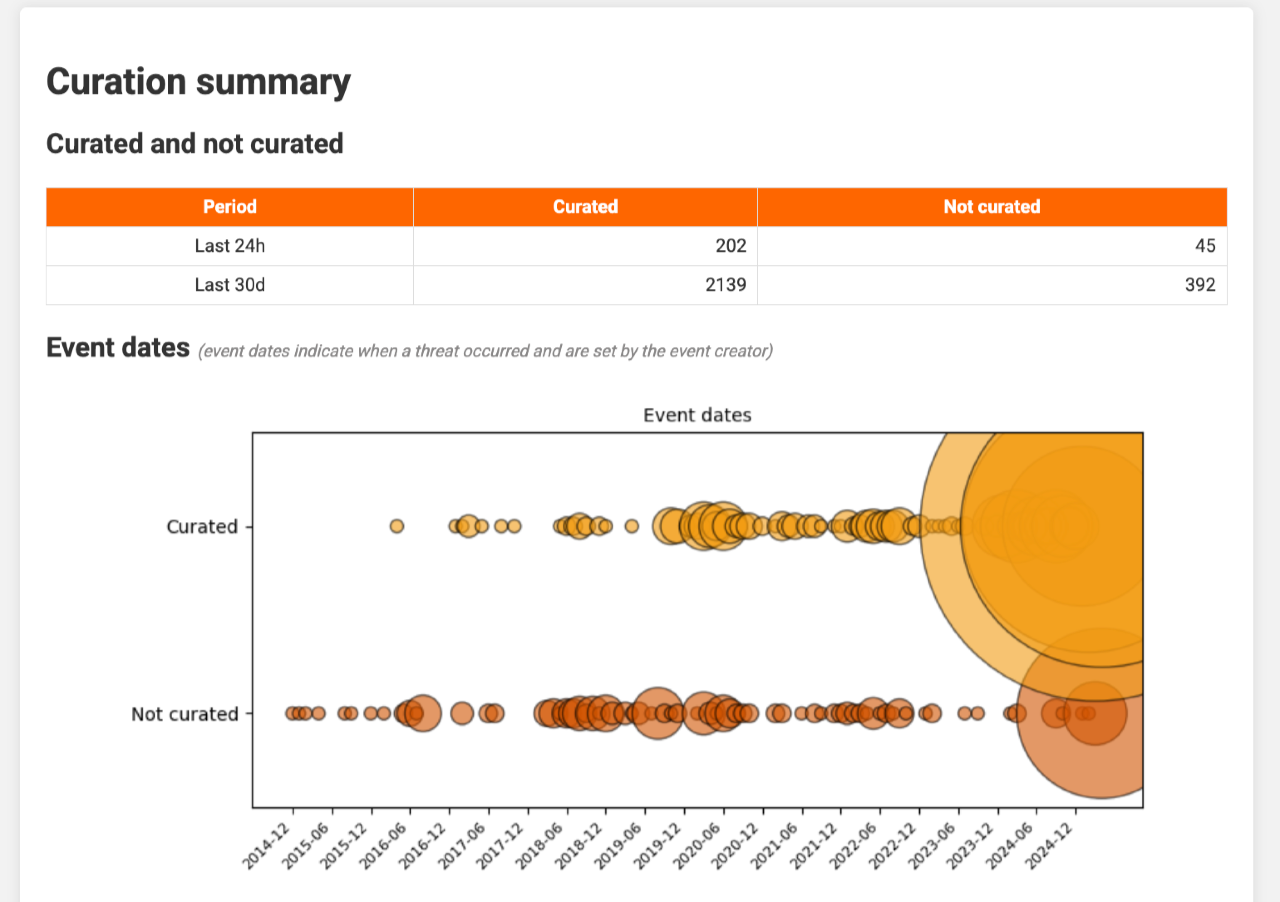
The curation report shows how many threat events have been curated—either automatically or manually. A typical curation process checks events against the MISP warninglists and the CIRCL Hashlookup service; matches lead to indicators being marked non‑actionable (the to_ids flag is cleared). Curation may also enrich events with contextual data. In this setup, curated events are placed in the local workflow state complete; uncurated events remain incomplete.
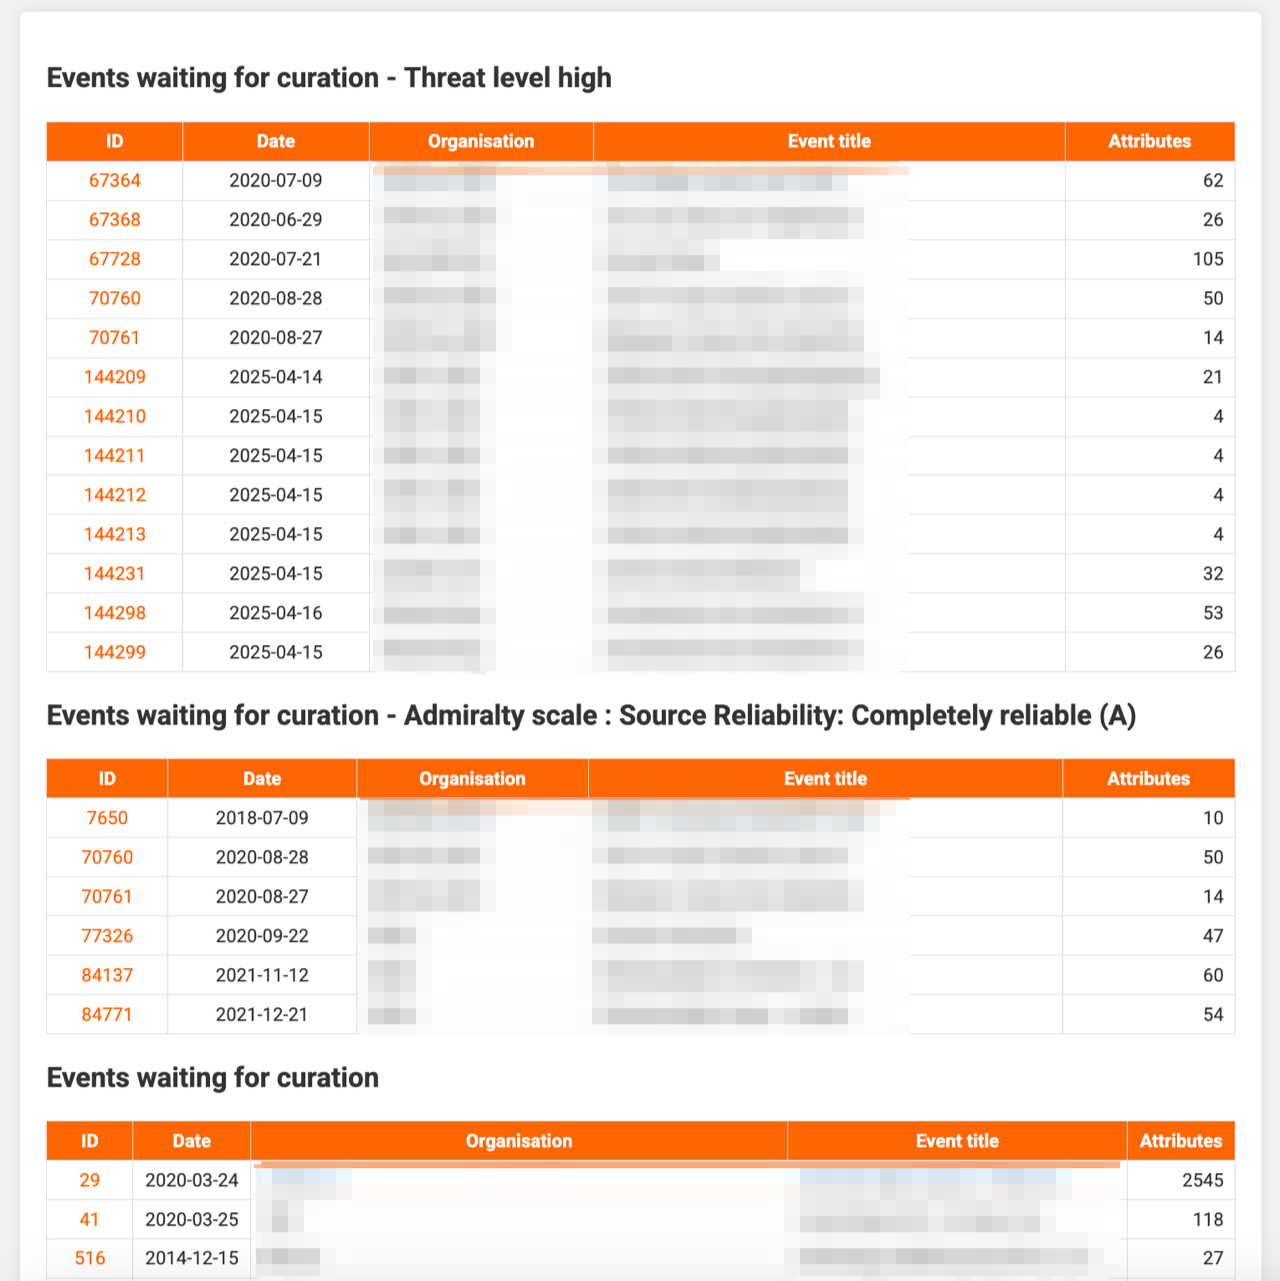
The opening section lists how many events are awaiting curation, how many high‑threat events are waiting, and how many events from completely reliable sources are pending. Links take you straight to each set in MISP.
Next, the report plots the dates of curated and uncurated events so you can see whether outstanding items are recent or historic.
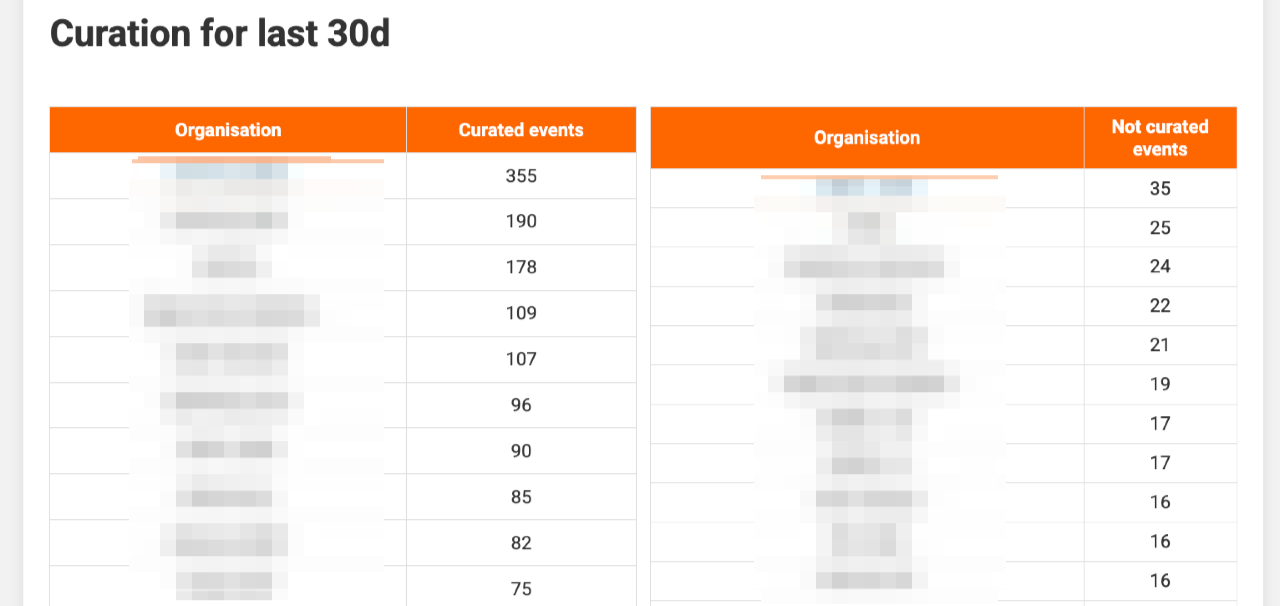
You can also view the volume of curated versus uncurated events per organisation.
Finally, a table lists the individual events, highlighting those with high threat levels and those from fully reliable sources. This helps you prioritise urgent reviews. For automation ideas see the MISP playbook Curate threat events.
Statistics file
Besides the HTML reports, misp‑reporting creates a JSON file, statistics.json, suitable for other tools:
{
    "misp_server": "https://misp",
    "report_date": "2025-04-16",
    "statistics": "{'event_count': 138584, 'attribute_count': 6877874, 'user_count': 2, 'org_count': 1124, 'local_org_count': 2}",
    "today_statistics": "{'today_event_count': 36598, 'today_attribute_count': 36598, 'today_attribute_ids_count': 29370}",
    "today_statistics_attributes": "{'hashes': 4017, 'url': 295, 'domain': 22422, 'Other': 607, 'email': 22, 'network': 2007}"
}
Graphics
All images are stored in the report directory and may be reused elsewhere:
attributes_bar_chart.pngattributes_type_bar_chart.pngcurated_events_bubble_chart.pnggeo_targeting_map.pngthreatlevel_bar_chart.pngthreat_levels_bar.pngtlp_pie_chart.pngattributes_trending.pngattributes_type_daily_bar_chart.pngevents_trending.pngthreatlevel_pie_chart.pngthreat_levels_pie.pngtrending_graph.png
Prevent unauthenticated access
By default, everything under /var/www/MISP/app/webroot/misp-reporting is publicly accessible. To restrict access, modify MISP core as explained in github.com/MISP/MISP/issues/10272 by editing /var/www/MISP/app/AttributesController.php.