

By Koen Van Impe August 22, 2020
MISP service monitoring with Cacti
Introduction
A previous post covered how to do MISP service monitoring with OpenNSM. Because having different options is good, this post covers how to achieve similar results with Cacti. For those not familiar with Cacti: it is a network graphing solution designed to harness the power of RRDTool’s data storage and graphing functionality.
We’ll monitor these aspects of a MISP server
- CPU, load average, memory usage and swap usage (based on default Cacti templates)
- Interface statistics, logged in users and running processes (based on default Cacti templates)
- MISP workers and job count
- MISP event, attribute, users and organisation statistics
- HTTP response time
Interesting to know is that MISP already also has built-in features to monitor your system resources via widgets and dashboards. There are widgets for monitoring system resources, MISP statistics and sightings.
Cacti monitoring
Install SNMP
Cacti provides out of the box a lot of default templates to monitor system data. The data acquisition is mostly done via SNMP, or the Simple Network Management Protocol. You do not need additional client software but it does mean you have to install SNMP on the MISP server, and allow access on udp/161 from your Cacti host to the MISP server.
sudo apt-get install snmpd
sudo ufw allow proto udp from <cactihost> to any port 161
When SNMP is installed, make sure you set a read-only community string if you use version 2c or configure user authentication with version 3. Note that for version 2c the community string is sent in clear text. Cacti supports both SNMP versions 2c and version 3.
Add a device
You can find plenty of good writeups on how to monitor a Linux host with Cacti at sysadmin.md and NSRC.
The key items to remember are
- Choose Net-SNMP Device as device template
- Set the correct SNMP Community String or SNMP User Authentication
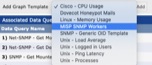
Once you added your MISP server as a device in Cacti, add these Graph Template
- Host MIB - Logged in Users
- Host MIB - Processes
- Net-SNMP - CPU Utilization
- Net-SNMP - Load Average
- Net-SNMP - Memory Usage
And finally, add these Data Queries
- Net-SNMP - Get Monitored Partitions
- SNMP - Get Mounted Partitions
- SNMP - Get Processor Information
- SNMP - Interface Statistics
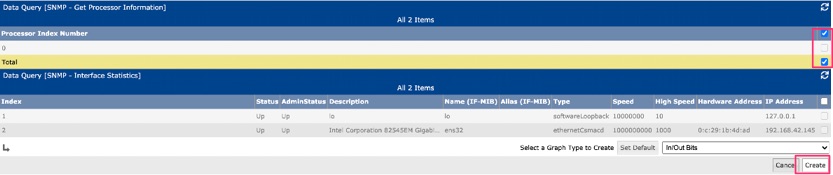
Afterwards click on Create Graphs for this Device to get an overview of available graphs. Then select the desired graphs and click on Create.
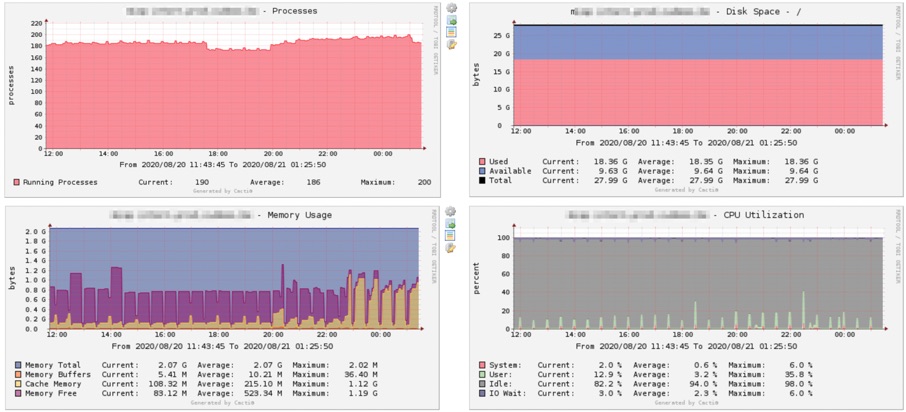
Allow it a bit of time so that Cacti can create the RRD files (RRDs are little ‘databases’ containing the statistics data) and poll sufficient information. If all goes well, you should have graphs similar to the ones below.
MISP Workers and Statistics
Now let’s work our way to more specific MISP monitoring. The MISP data isn’t directly available via SNMP. But one of the nicer features of SNMP is that you can extend it with your own scripts, and have it return whatever data your script has access to. In order to make this work you have to specify the script name, how it is called from within SNMP and have the script return the statistic values.
SNMP configuration
Open the config file /etc/snmp/snmpd.conf and add these lines to extend SNMP with data for misp-workers, misp-jobs, misp-stats and misp-users.
extend  misp-workers    /home/misp/misp-snmp/misp-snmp-monitor.py workers
extend  misp-jobs       /home/misp/misp-snmp/misp-snmp-monitor.py jobs
extend  misp-stats      /home/misp/misp-snmp/misp-snmp-monitor.py stats
extend  misp-users      /home/misp/misp-snmp/misp-snmp-monitor.py users
There are some extra things to consider. First, the script (misp-snmp-monitor.py) is not placed in the MISP working directory (commonly /var/www/MISP). The reason is that the script is called by the SNMP daemon, which on Ubuntu runs under the username Debian-snmp. By default, this user does not have access to the MISP working directory. You can choose to grant permissions for the SNMP daemon user to the MISP working directory (less desired), or you can put this script in a dedicated directory and then set permissions there.
Second, Cacti will not call the keys ‘misp-workers’ or ‘misp-jobs’ directly, but will call them by their OID, or object identifiers. Simply put, an OID is a unique identifier mechanism to refer to (in this case) a value available in the SNMP database (this is an oversimplification of MIB). To access these values from within Cacti, you first have to translate them from the “string” value to the OID value. As it happens, SNMP has a tool for this.
snmptranslate -On 'NET-SNMP-EXTEND-MIB::nsExtendOutLine."misp-workers".1'
This will return the OID value .1.3.6.1.4.1.8072.1.3.2.4.1.2.12.109.105.115.112.45.119.111.114.107.101.114.115.1, which can then be used by Cacti. The last part of the OID, the .1, is the ID of the value returned. misp-snmp-monitor.py returns these values
- misp-workers: .1.3.6.1.4.1.8072.1.3.2.4.1.2.12.109.105.115.112.45.119.111.114.107.101.114.115.x
- x = 1 = Number of workers alive
- x = 2 = Number of dead workers
- misp-jobs: .1.3.6.1.4.1.8072.1.3.2.4.1.2.9.109.105.115.112.45.106.111.98.115.x
- x = 1 = Total number of jobs in all worker queues
- misp-stats: .1.3.6.1.4.1.8072.1.3.2.4.1.2.10.109.105.115.112.45.115.116.97.116.115.x
- x = 1 = Number of new events this month
- x = 2 = Number of new attributes this month
- misp-users: .1.3.6.1.4.1.8072.1.3.2.4.1.2.10.109.105.115.112.45.117.115.101.114.115.x
- x = 1 = Number of users in the MISP instance
- x = 2 = Number of organisations in the MISP instance
SNMP Script
Now install the misp-snmp-monitor script. The source code is available via Github PR-6221. There are a couple of configuration settings:
- misp_key : A MISP API key
- misp_url : The URL to your MISP instance
- misp_cachefile : A location where it can store cached data. The script is called via the SNMP daemon, as such, the SNMP user (for Ubuntu Debian-snmp) needs write permissions to this path. Also give it a full path, not a relative location.
The cache can be built manually, but it’s more interesting to have this generated automatically. Add a crontab entry which to update the cached data.
*/30 * * * * misp /home/misp/misp-snmp/misp-monitor.py update
Test it first
Before we jump to Cacti, it’s safe to first test that the flow MISP > monitor script > SNMP works. Do not forget to restart the SNMPD service! Then issue this command
snmpget -v2c -c <SNMP community string> <MISP host - misp_url> .1.3.6.1.4.1.8072.1.3.2.4.1.2.12.109.105.115.112.45.119.111.114.107.101.114.115.1
This calls the OID corresponding with the first (.1) value of the key misp-workers: the number of live workers. If all is well you should receive an answer similar to
iso.3.6.1.4.1.8072.1.3.2.4.1.2.12.109.105.115.112.45.119.111.114.107.101.114.115.1 = STRING: "6"
The answer above indicates that there are 6 workers alive. Do the same for all the other keys.
Configure Cacti
Next is configuring Cacti. You first have to configure a data source template, then a graph template and then add a new graph based on these templates to your device.
Data Source Template
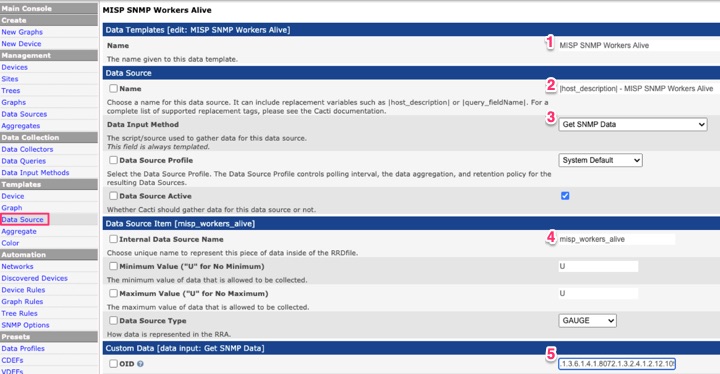
To add the data source, click on Data Source under Templates, and then in the upper right corner the + to add a new template. Then complete these values
- A data source template name, for example MISP SNMP Workers Alive
- The name for the data source, it is best to choose something similar as |host_description| - MISP SNMP Workers Alive. This will replace the data source name with the name of your device
- Select the data input method Get SNMP Data
- An internal name for the data source, such as misp_workers_alive
- Set the minimum and maximum value to no minimum/no maximum with U
- Add the OID corresponding with the SNMP value, this is the OID you retrieved via the snmptranslate command in the previous step.
You have to complete this step for all the data you’d like to be monitored, for example the job count, statistics, users, etc.
Graph Template
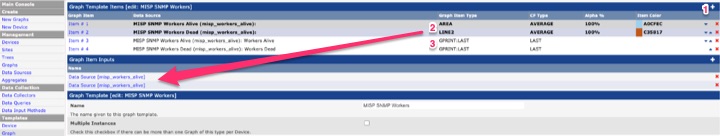
Add the graph template via Graph under Templates, and then in the upper right corner the + to add a new template. Then select these values
- Add the two new data source templates to the graph template
- Select Area as graph type for workers alive, and Line 2 as graph type for dead workers. Adding them will also automatically add them as graph item inputs.
- Add a text label to display the number of workers alive and dead. Choose GPrint:LAST and the LAST value type.
You can leave all the other values to their default settings.
You have to complete this step for all the data you’d like to be graphed, based on the previous created data sources.
Add to device
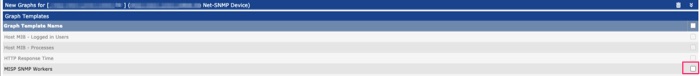
The final step is to add this graph template to your monitoring device. Under Management, Devices choose the MISP device and scroll down to Associated Graph Templates. If all is good, the newly created Graph Template should be available under Add Graph Template. Select it and click Add.
Then click Create Graphs for this Device, select the newly added graph and click Create.
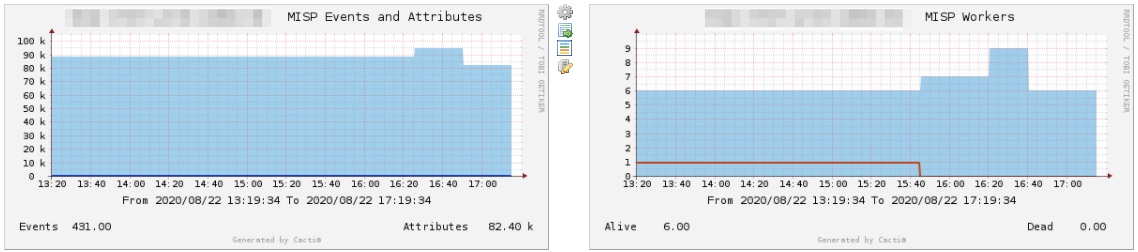
Similar as with the previous Cacti graphs, you need to give it some time before the values are collected and represented in the graphs.
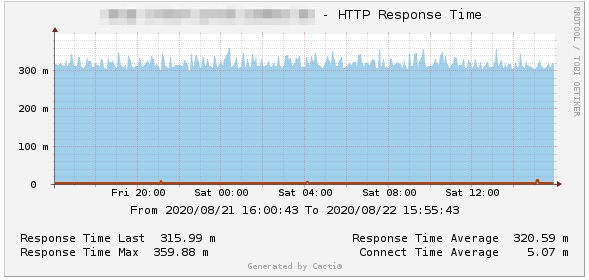
MISP HTTP Response time
The final item we’d like to monitor is the HTTP response time of our MISP server. This response time also gives an indication if the (web) server is still properly running or not. We will use curl to get the statistics back from our server.
HTTP Monitor with Curl
The standard install of Cacti does not have an HTTP response monitor but you can easily add this yourself. On the Cacti server, in the directory cacti/scripts add a bash file with the name http_response.sh and this content
#!/bin/sh
curl -o /dev/null -s -w "time_total:%{time_total} time_connect:%{time_connect}" $1
This bash script takes one parameter ($1) for the curl command. Curl will then return the total transaction time (time_total) and the connection time (time_connect).
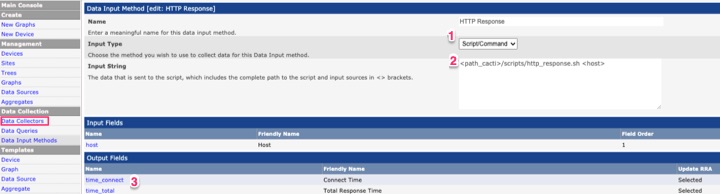
Data Collector
Add a new Data Collector under Data Collection. This new data collector will start the bash script and return the data to Cacti.
- Select Script/Command as input type
- Point it to the script you just added.
- Add two output fields, which should point to the two fields returned by the script (time_connect and time_total).
Graph Template and add to device
Now similar as for the graphing of MISP information, add a new graph template and include the HTTP response code data source. Afterwards add the graph template to your device, and create a new graph based on this template.
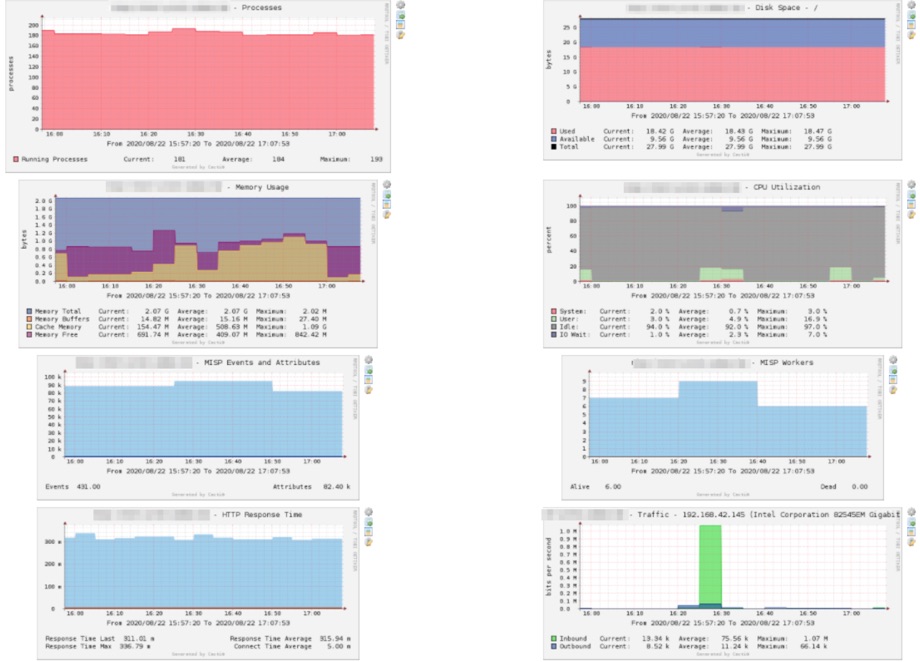
Dashboard
If all goes well, you should be able to build a dashboard in Cacti, representing the crucial MISP values.